|
SPREADSHEETS TUTORIAL
EXAMPLE : Investigation of Properties of Light as it moves
from glass to air
| i (deg) |
5 |
10 |
15 |
20 |
25 |
30 |
35 |
40 |
45 |
50 |
55 |
60 |
65 |
70 |
| r (deg) |
8.0 |
14.0 |
22.0 |
29.0 |
36.0 |
44.0 |
54.0 |
64.0 |
90.0 |
- 50 |
-55 |
-60 |
-65 |
-70 |
N.B Negative values of (r) indicate that the
ray of light is totally internally reflected in glass.
Part 1: Simple Analysis
Plot a graph of angle of refraction (r) against angle of
incidence (i) up until the ray reflects.
Note: Negative values of (r) imply that the ray of light is
totally internally reflected in glass.

Look
at the SpreadSheet (Excel)
The graph above shows that the angle of refraction (r) increases
as the angle of incidence (i) increases.
Part 2 : Full Analysis
Plot a graph of sin ( r) against sin ( i) up until
the ray reflects.
Proceed as follows:
(a) Change the angles of incidence(i) and those of
refraction (r) from degrees to radians
Hint: 1 degree
= PI( ) where PI() is a function
to calculate p
180
e.g 20 degrees = PI()
x 20 = 0.35
180
(b) (i) Name the range containing the angles of incidence(i)
the "i" range.
Use Insert --> Name --> Define from the
main menu
(ii) Name the range containing
the angles of refraction (r) the "ref" range
(c) Calculate the values of the angles of incidence in radians
using i * PI()/180 and the angles of refraction
in radians using ref * PI()/180
(d) Use Insert --> Function ---> Math
& Trig ---> SIN to paste the SIN() function
and
use it to calculate the values of sin (r) and sin (i).
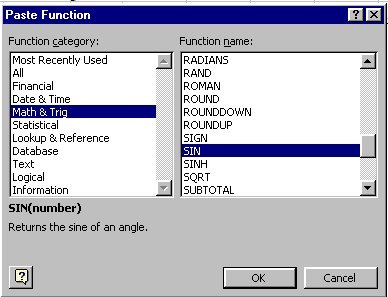
Note in SIN(number), the number must
be the angle in radians.
(e) Block the columm for sin (i) and sin (r) and plot
the XY (scatter) chart up to when the ray is totally internally
reflected in glass.
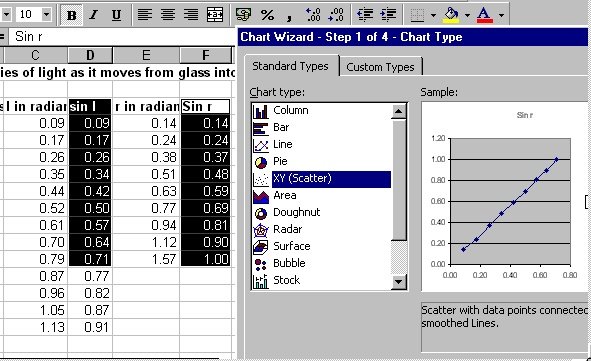
(f) Finish off the steps involved in inserting the chart.
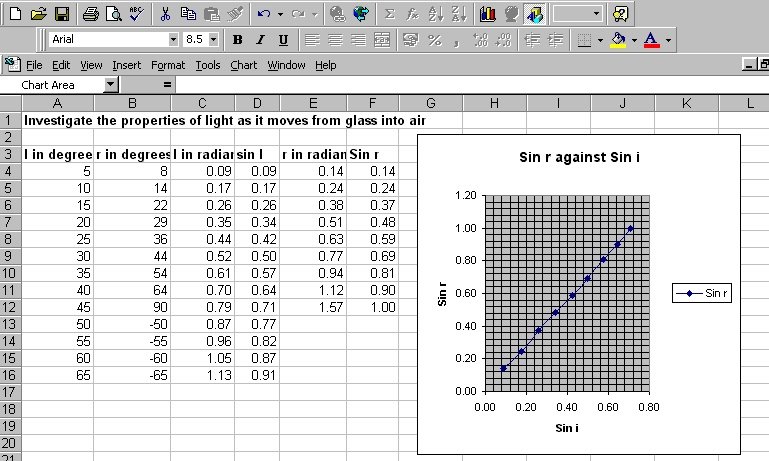
Take a look at
the SpreadSheet (Excel)
The above graph shows that sin (r) is directly proportional
to sin (i).
Sin (r)/Sin (i) = A constant
(Snell's law)
|