Back to Home
Page of CD3WD Project or Back to list of CD3WD Publications
 |  |  | Surface Water Drainage for Low-Income Communities (UNEP - WHO, 1991, 98 p.) | |  | (introduction...) | | | Acknowledgements | |  | 1. Surface water drainage in urban areas | | | 2. Drainage options | | | 3. Rehabilitation and maintenance | | | 4. Community participation | | | Annex 1. Glossary1 |  | | Annex 2. Design calculations | | | Annex 3. Terms of reference for consultants | | | Annex 4. Resources for the orientation of the drainage committee | | | Selected WHO publications of related interest | | | Back cover |
|
Annex 2. Design calculations
Basic concepts
The basic concepts of return period and runoff coefficient are
explained in section 2.2. Two other important concepts are involved in drainage
design calculations: rainfall intensity and concentration time.
Rainfall is normally measured in millimetres; 1 mm of rainfall
on a flat area of land, with no infiltration into the ground, evaporation into
the air, or runoff to drainage, would flood the area to a depth of 1 mm.
Rainfall intensity is a measure of the rate at which rain is falling, and is
usually expressed in mm/hour.
The intensity of rainfall varies during each storm, reaching a
peak value much greater than the average for the whole storm. Very high rates of
rainfall can come in bursts lasting a few minutes, but not long enough to cause
flooding or serious erosion. An important question therefore is the period of
time over which rainfall is to be calculated. For a duration of a few minutes,
very high intensities would be reached, a drain designed on this basis would be
unnecessarily large and expensive. However, if the rainfall intensity is taken
as the average for the entire duration of the storm, this would give too low a
figure, and drains designed using it would be overloaded for much of the time.
The way in which rainfall intensity is related to duration and return period is
illustrated by Fig. A2.1, which is based on records for the city of Cebu,
Philippines. (Note: the curves in Fig. A2.1 cannot be used in other cities,
because rainfall conditions vary greatly in different parts of the world.)
The correct duration to use in designing a drain is the
“concentration time” of the catchment area which it serves. That is,
the amount of time required for water falling on the most far-flung point in the
catchment area to run over the ground, into the drainage system, and downstream
to the drain that is to be designed. Smaller catchment areas have shorter
concentration times. Water flows faster down relatively steep slopes, so that
concentration times are also shorter in hilly areas.
However, very short bursts of rainfall lasting less than 15
minutes are unlikely to do serious damage. Thus, a reasonable rule of thumb for
small catchment areas (less than 5 ha) is to use a concentration time of 15
minutes. Where average land slopes are greater than 0.5%, this time can be used
for areas up to 20 ha. In flatter areas, slightly longer concentration times can
be used for areas over 4 ha. A reasonable approximation would be to add one
minute for each extra hectare up to 20 ha. For larger catchment areas, it is
advisable to consult an engineer.
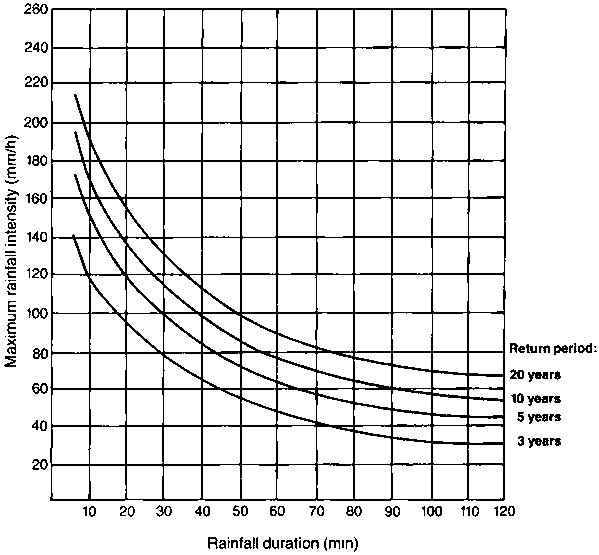
Fig. A2.1. Rainfall
intensity-duration graph for Cebu, Philippines
Calculating stormwater flow
In order to design a drain it is first necessary to calculate
the maximum stormwater flow that it will be required to carry. This involves the
following steps.
(a) Decide on the appropriate return period
and concentration time.
(b) Find the maximum rainfall intensity for
those conditions (I mm/h).
(c) Calculate the catchment area
served by the drain ( A ha).
(d) Estimate the runoff
coefficient for that catchment (C).
(e) From I, A and
C, calculate the peak flow - the maximum quantity of water to be drained
per second.
These steps are discussed below.
(a) Return period and concentration
time. The choice of these is described in section 2.2 and on pages 73-74,
respectively.
(b) Rainfall intensity. Ideally, this should be
found from an intensity-duration graph of the same form as Fig. A2.1. However, a
graph compiled for one city should not be used for another city without
professional advice.
Rainfall data can be obtained from the department of hydrology
or water resources. If intensity-duration data are not available, an estimate
can be made using the maximum daily rainfall for the appropriate return period.
In each climatic zone, maximum rainfall in 15 minutes is a fairly constant
percentage of the maximum daily total - typically between 10% and 40%.
(c) Catchment area. This is most conveniently
estimated from a map. First the edges of the catchment area are drawn. Some
investigation in the field may be needed to ascertain the full extent of the
area from which surface water will run to the drain being designed. The area on
the map can then be measured with a planimeter, or estimated by dividing it into
squares. Squares whose sides are equivalent to 100 m on the map will each have
an area of 1 ha. For smaller areas, smaller squares can be used. Each 10 ×
10 m square will have an area of 0.01 ha.
(d) Runoff coefficient. As indicated previously,
the runoff coefficient depends on soil conditions, terrain and land use. The
first step is to determine the runoff coefficient (Cu) for the
uncovered areas, that is, for the areas which are not paved or covered by
buildings. Values of Cu are given in Table A2.1. Then an
estimate must be made of the percentage (P) of the total catchment area
that is covered by impermeable pavements or the roofs of buildings. This could
be done from an aerial photograph, but the process is very laborious. A
reasonable estimate can be made from the population density using Table A2.2.
Then the overall runoff coefficient for the catchment area (C) can be
derived using Fig. A2.2.
(e) Peak flow. For small catchments, this is best
calculated using the “rational method”, expressed by the
formula:
Q = 2.78 CIA
where
Q = flow (l/s)
C = runoff
coefficient
I= rainfall intensity (mm/h)
A= catchment area
(ha).
Table A2.1. Values of Cu, the runoff
coefficient for areas not paved or covered with
buildingsa,b
I. Humid regions
|
Average ground slope |
Soil permeability |
|
very low
(rock and clay) |
low
(clay loam) |
medium
(sandy loam) |
high
(sand and gravel) |
|
Flat: 0-1% |
0.55 |
0.40 |
0.20 |
0.05 |
|
Gentle: 1-4% |
0.75 |
0.55 |
0.35 |
0.20 |
|
Medium: 4-10% |
0.85 |
0.65 |
0.45 |
0.30 |
|
Steep: > 10% |
0.95 |
0.75 |
0.55 |
0.40 |
II. Semi-arid regions
|
Average ground slope |
Soil permeability |
|
very low
(rock and clay) |
low
(clay loam) |
medium
(sandy loam) |
high
(sand and gravel) |
|
Flat: 0-1% |
0.75 |
0.40 |
0.05 |
0.0 |
|
Gentle: 1-4% |
0.85 |
0.55 |
0.20 |
0.0 |
|
Medium: 4-10% |
0.95 |
0.70 |
0.30 |
0.0 |
|
Steep: > 10% |
1.00 |
0.80 |
0.50 |
0.05 |
a From WATKINS, L. H. &
FIDDES, D. Highway and urban hydrology in the tropics. London, Pentech
Press, 1984.
b In case of doubt, part I can be used
for those regions of the world shaded black in Fig. I, and part II for the
remainder.
Table A2.2. Typical values of the percentage of impermeable
paved and covered areas in low-income urban settlements (P)
|
Population density
(residents/ha) |
P
(%) |
|
0-50 |
0-12 |
|
100 |
25 |
|
200 |
50 |
|
300 |
75 |
|
> 400 |
100 |
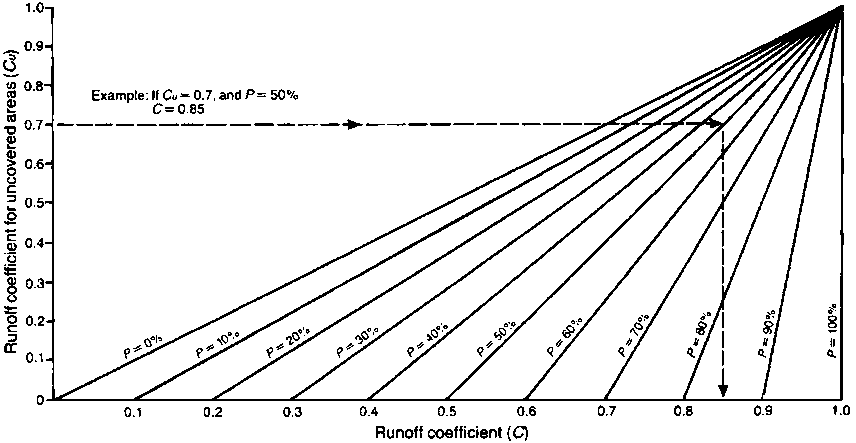
Fig. A2.2. Diagram for deriving the
runoff coefficient (C) from the coefficient for the unpaved area
(Cu) and the percentage of paved area (P)
For catchment areas larger than about 5 ha, other calculation
methods are more accurate, but they tend to be rather more complex.
Example
Calculate the flow capacity needed for a drain in a flat part of
Cebu, Philippines, with a clay soil. The drain serves a catchment area of 3 ha
inhabited by 600 people.
(a) The area is flat, so there is no danger
of erosion. A relatively short return period (say, 3 years) is therefore
suitable. The area is less than 4 ha, so concentration time can be taken as 15
min.
(b) Using Fig. A2.1, for a return period of 3 years and a
duration of 15 min, the rainfall intensity I= 107 mm/ha.
(c) Catchment area A = 3 ha.
(d) The Philippines is in a humid region. Using Table
A2.1, for a flat, clay terrain, Cu =
0.55.
Population density =  = 200 residents/ha.
Using Table A2.2, percentage paved area P = 50.
Hence using Fig. A2.2, the runoff coefficient C = 0.77.
(e) Finally, to calculate the flow:
Q = 2.78 CIA
=2.78 × 0.77
× 107 × 3
=687 l/s
Calculating drain size
Once the flow has been determined, it is possible to derive the
required dimensions of the drain cross-section. Engineers often do this using
the Manning formula:
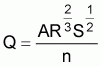
where
Q = flow in the drain (m3/s)
A = area of the channel cross-section (m2)
R = the “hydraulic radius” of the drain
cross-section (m); to calculate this, divide the cross-sectional area by the
“wetted perimeter”, that is, the length of the perimeter of the
channel cross-section which is in contact with the water, not counting the water
surface
S = slope of the drain; for a 1% slope, S = 0.01
n = a constant that depends on the roughness of the
channel lining; typical values of n are:
n = 0.015 for a smooth concrete
or plastered brick masonry;
n = 0.025 for straight unlined channels
free of vegetation;
n = 0.035 for unlined channels with short grass
and few weeds.
However, many readers will find it simpler to use Fig. A2.3.
This is a design chart for a channel with the trapezoidal cross-section shown in
the inset, which has no lining or vegetation (n = 0.025). The channel
depth D obtained from Fig. A2.3 can be used to derive the dimensions of
channels and pipes with other shapes and other types of lining. The procedure
then is as follows:
(a) Find the maximum flow in l/s, as
described on pages 74-78.
(b) Find the slope of the section to be designed in % (1%
means a vertical drop of 1 m in every 100 m of drain).
(c) Use Fig. A2.3 to find the value of D for this
slope and flow.
(d) If the drain is not a trapezoidal channel, multiply
D by the factor given in Fig. A2.4 to derive the dimensions for the
appropriate shape of cross-section. If the drain cross-section does not
correspond exactly to any of the shapes shown in Fig. A2.4, choose the nearest
equivalent and follow the method to find the size required for the standard
cross-section. Then plan for the dimensions of the drain to have the same
cross-sectional area as the standard cross-section design.
(e) If the drain is to have a smooth lining, or if the
sides and bottom will be covered with short grass, the dimensions will need
further adjustment:
- for smooth concrete or plastered brick
masonry lining, multiply the dimensions by 0.83 (i.e., reduce by 17%),
- for unlined channels with short grass and few weeds,
multiply the dimensions by 1.13 (i.e., increase by 13%);
- for a smooth earth or unplastered masonry lining, no
adjustment is needed.
(f) Finally, calculate the average speed of
flow of the water when the drain is running full. If the flow is so rapid that
it would cause erosion of an unlined channel, the channel should be lined, or at
least stabilized with grass. Step (e) above should then be repeated for a
lined or grassed channel.
On the other hand, too low a speed will fail to achieve
self-cleansing and so allow sediment to accumulate. If possible, a speed of at
least 0.5 m/s should be achieved in all drains when flowing full. A speed of 1.0
m/s would be better still.
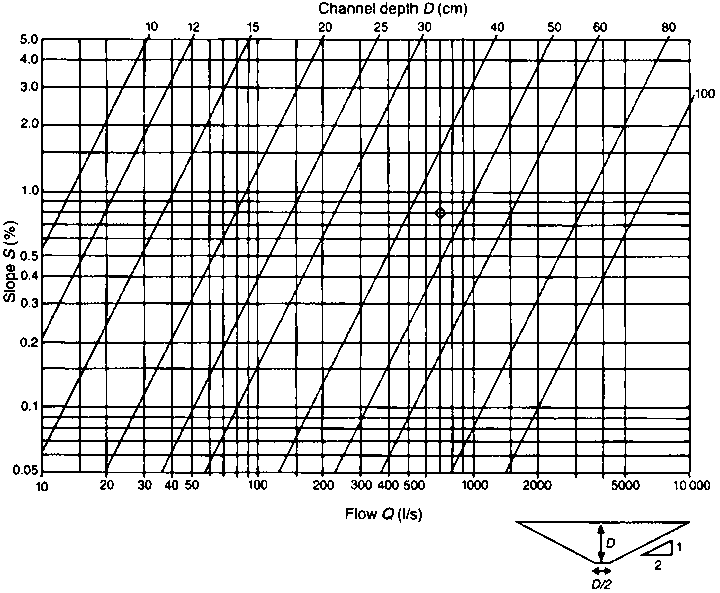
Fig. A2.3. Design chart for small
drains with a trapezoidal cross-section and no lining or vegetation
Fig. A2.4. Calculating the dimensions of various types of
drain, using values of channel depth (D) from Fig. A2.3
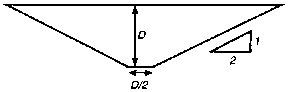
(a) Trapezoidal channel
Base width = 
Side slope = 1 in 2
Find D from Fig.
A2.3.
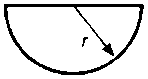
(b) Semicircular
channel
Radius r = 1.2 D
Find D from Fig.
A2.3.
Then multiply by 1.2 (i.e., add 20%)
to find r.
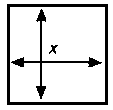
(c) Square channel
Side x = 1.56 D
Find D from
Fig. A2.3.
Then multiply by 1.56 (i.e., add 56%)
to find
x.
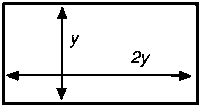
(d) Rectangular channel
Depth y, width 2y
y= 1.1
D
Find D from Fig. A2.3.
Then multiply by 1.1 (i.e., add
10%)
to find y.
(e) Closed circular pipe,
flowing full
Diameter d = 1.34 D
Find D
from Fig. A2.3.
Then multiply by 1.34 (i.e., add 34%)
to find
d.
Checking the speed of flow
Once the dimensions of a drain have been chosen, the
cross-sectional area can be calculated from them. The average speed of flow can
be found from the formula:

where
V = flow speed in m/s
Q = flow in
l/s
A = cross-sectional area in cm2.
If this speed is found to be greater than the corresponding
value in Table A2.3, there is a danger of serious erosion unless the drain is
lined or provided with checkwalls (see section 2.3). Table A2.3 also gives
maximum permissible speeds of flow in channels whose sides and base are
stabilized by a firm cover of grass.
Table A2.3. Permissible flow speeds to prevent erosion in
unlined drainage channelsa
|
Type of soil |
Typical particle size (mm) |
Permissible speed (m/s) |
|
Fine sand |
0.05 |
0.4 |
|
Sandy loam |
- |
0.7 |
|
Medium sand |
1.0 |
0.8 |
|
Silty loam |
- |
0.8 |
|
Ordinary firm loam |
- |
1.0 |
|
Volcanic ash |
- |
1.0 |
|
Coarse sand |
2.5 |
1.0 |
|
Stiff clay |
- |
1.5 |
|
Alluvial silt |
- |
1.5 |
|
Shales and hardpans |
- |
1.8 |
|
Fine gravel |
5 |
1.5 |
|
Coarse gravel |
10 |
1.8 |
|
Cobbles and shingles |
40 |
2.4 |
|
Grass cover, erodible soils |
- |
1.2 |
|
Grass cover, stable soils |
- |
1.8 |
a From: CHOW, V. T.
Open-channel hydraulics. New York, McGraw-Hill, 1959; and WATKINS, L. H.
& FIDDES, D. Highway and urban hydrology in the tropics, London,
Pentech Press, 1984.
Example
Design a square concrete channel to drain a peak flow of 687
l/s. The channel bed level falls 40 cm along a 50 m length.
(a) Flow Q=687
l/s
(b) 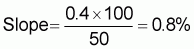
(c) On the left side of the design chart (Fig. A2.3),
find the 0.8% slope, and on the bottom of the chart find the approximate point
corresponding to 687 l/s (very slightly to the left of the 700 l/s point). Find
where the corresponding horizontal and vertical lines cross; the point is marked
in Fig. A2.3.
This point is roughly half-way between the two sloping lines for
D = 40 cm and D = 50 cm respectively. By interpolation, take D
= 45 cm.
(d) Using Fig. A2.4(c), it can be seen that this
value must be increased by 56% to give the width of a square
channel:
45 × 1.56=70 cm
(e) Since the lining is of concrete, the
width can be adjusted to allow for the reduced friction from the smooth channel
sides. The dimensions can be reduced by 17%:
70
× 0.83 = 58 cm
Rounding up the result to a convenient value, the
drain can be 60 cm deep and 60 cm wide.
(f) This channel will have a cross-sectional area of 3600
cm2. The speed of flow V will therefore be
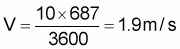
This speed of flow would cause erosion in almost any unlined
drain, but not in a well-built concrete channel. A speed of 1.9 m/s is more than
enough for self-cleansing; silt deposition will not be a problem in this
drain.


