| Planning of Water and Hydropower Intake Structures (GTZ, 1989, 122 p.) | ||||
| 4. Necessary proofs of stability | ||||
| (introduction...) | ||||
| 4.1 Prevention of hydraulic shear failure | ||||
| 4.2 Stability against sliding | ||||
|
| |||||||||||||||||||||||||
In the investigation into the stability of fixed weirs and other structures subject to underflow, proof of safety with regard to sliding and hydraulic shear failure must be given.
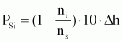
To prevent hydraulic shear failure, the critical hydraulic gradient

must be twice the existing hydraulic gradient

where gF = specific weight of the soil particles/of the soil in situ kn kN/m³, gW = specific weight of water, about 10 kN/m³, n = pore volume proportion, Dh = difference in water level between headwater and tail water in m, nS = number of potential lines, DnS = distance between two neighbouring potential lines in m.
Empirical values for gF
|
- sand/gravel |
20 kN/m³ |
|
- rubble with sand |
19 kN/m³ |
|
- clay |
20 kN/m³ |
|
- sandy clay/clayey sand |
21 kN/m³ |
|
- silt |
19 kN/m³ |
Empirical values for n:
|
- sand/gravel |
35% |
|
- rubble with sand |
45% |
|
- clay |
60% |
|
- sandy clay/clayey sand |
45% |
|
- silt |
45% |
To determine the number of potential lines, the stream and
potential line net must be constructed as follows:
Marking of the stream
lines around the structure subject to underflow (cf. Fig. 41). Here the
following points must be observed:
- The topmost stream line is represented by the foundation of the structure or the sheet piling (straight BC-DC) and the bottommost stream line by the surface of the watertight layer (if such a layer exists) (straight FG).
- At narrow points of the seepage section the distances between the stream lines are smaller.
Marking of the potential lines. Here, the following points must be observed:
- At the points of intersection the stream lines and the potential lines must always be vertical to one another.
- The first potential line is the bottom of the headwater (straight AB), the last potential line the bottom of the tail water (straight DE).
- The distance of the centre lines b and 1 kn an individual field is equal.
In the case of structures subject to underflow, hydraulic shear failure can result wherever there are buoyant forces at the end of the foundation due to the seepage flow from the headwater to the tail water (cf. Fig. 42). At times of low water, for example, at a great water level difference Dh, these forces can become so strong that the pressure due to the seepage flow pushes the river bottom area at the end of the weir upwards, and the weir foundation is damaged by headward erosion.
Fig. 41: Construction of a stream and
potential line net
The danger of hydraulic shear failure is encountered particularly at times of low water because then the necessary water surcharge is lacking in the tail water and the water level difference h can be very great. The danger of shear failure can be reduced by lengthening the path of seepage below or on the structure or by arranging large stone blocks on the tail water bottom of the endangered area.
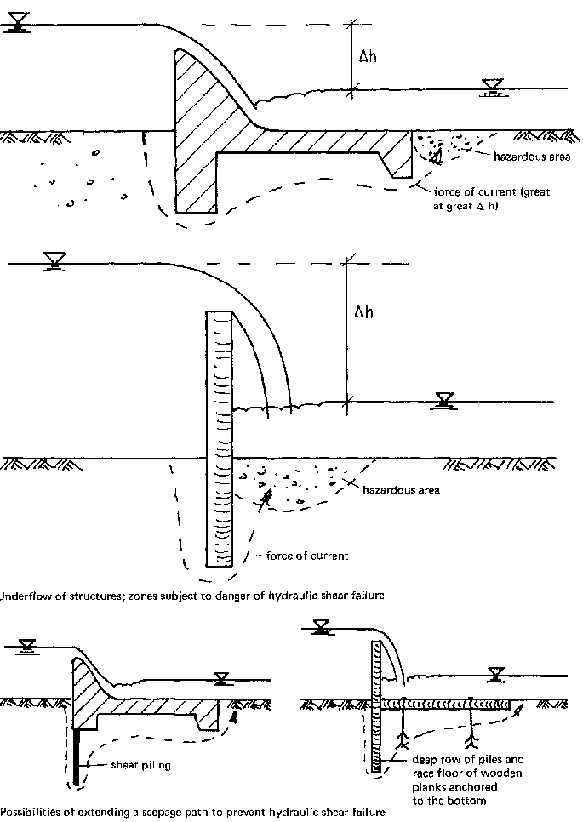
Fig. 42: Risk of hydraulic shear
failure at the weir end in the tail water area
To lengthen the path of seepage, either a longer weir with a longer race floor can be constructed or sheet pilings (rows of piles) placed at the beginning and, if necessary, also at the end of the weir foundation (cf. Fig. 42).
A numerical example of proof of safety from hydraulic shear failure is given in Annex 9.
To prove stability against sliding in the foundation area of a fixed weir, the shear strength in the slip joint must be greater than the shear force. The stability against sliding is calculated as follows:
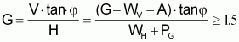
where V = vertical forces: G = weight of the structure in kN,
WV = water surcharge on the structure in kN, A = buoyancy in kN;
H
= horizontal forces: WH = horizontal water pressure in kN, PG = bed
load pressure in kN; tan j = friction
coefficient between soil/soil and concrete/soil.
Empirical values for various
friction coefficients (concrete/soil):
|
Noncohesive soils |
tan j |
|
sand |
0.56 |
|
gravel |
0.60 |
|
rubble/stones |
0.70 |
Cohesive soils
|
clay |
0.20 |
|
sandy clay |
0.30 |
The buoyant forces due to the uplift below a structure subject to underflow result from the seepage water pressure and the tail water pressure (Fig. 43).
The seepage water pressure is determined for defined points such as structure edges. For this purpose the potential and stream line net of the seepage flow must be drawn. As after each potential line the seepage water pressure decreases in the direction of flow by the amount
 (in kN/m²)
with nS = total number of potential steps, Dh = difference between headwater and tail water level in m,
(Fig. 43), the seepage water pressure at a specific point i is
 (in kN/m²)
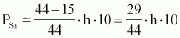
with PSi = seepage water pressure at the point i being sought in the foundation of the structure in kN/m², ni = number of potential steps in the direction of flow up to the point i being sought.
The tail water pressure corresponds to the difference in height between the tail water level and the foundation of the structure. (Example: At a tail water level of 1.50 m, the tail water pressure Pu = 10 Dh = 10 1.50 m = 15 kN/m².)
The horizontal forces are made up of the water pressure and the earth pressure of the bed load at the downstream face of the weir.
The horizontal water pressure force per metre of weir width is determined by
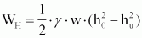 (in kN/m)
with gw = specific weight of water ~ 10 kN/m³, h0 = headwater level in m, hu = tail water level in m.
Number of potential lines n2 = 44 (numerical example)
| |
left lower edge of weir (a) |
right lower edge of weir (b) |
|
number of potential lines up to edge |
na)= 15 |
nb)= 30 |
|
seepage water pressure up to edge |
|
|
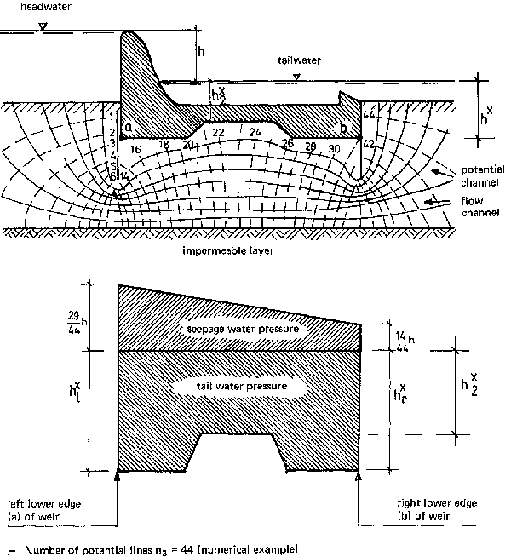
Fig. 43: Bottom water pressure,
stream and potential line net in the case of a structure subject to underflow,
with 2 sheet pilings
In the case of strong bed load deposits, the bed load pressure force at the downstream face of the weir per metre of weir width is
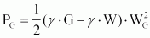 (in kN/m)
with gG = specific weight of the bed load in kN/m³, gW = specific weight of the water ~ 10 kN/m³, WG = height of the amount of bed load at the downstream face of the weir.
Empirical values for specific weights of different soils:
|
- sand/gravel |
20 kN/m³ |
|
- rubble with sand |
19 kN/m³ |
|
- clay |
20 kN/m³ |
|
- sandy clay/clayey sand |
21 kN/m³ |
|
- silt |
19 kN/m³ |
An increase in the stability against sliding can be achieved by the following measures:
- reinforcement of the foundation (placing at a lower level),
- extension of the weir, particularly of the race floor or of the stilling basin,
- increase in the weight of the weir and · reduction of the seepage water pressure by the arrangement of a toe wall at the beginning and at the end of the structure (lengthening of the path of seepage and corresponding decrease of the seepage water pressure).
A numerical example of the proof of stability against sliding of a fixed weir is given in Annex 10.