![]()
![]()
![]()
7.1. The interpretation of results of word find
7.2. Results by school and year
7.3. Subtest scores
7.4. Comments on word find test results
7.5. Results of Nyanja reading test, Nyanja V.01
7.6. Correlation of English test results with Nyanja test results
7.7. Significance of sex, rural/urban, school year and home language
7.8. Relationship between factors in educational provision and scores
The results of Word Find are difficult to interpret in an absolute evaluative sense. One cannot say whether the results indicate that the pupils concerned are "good" readers or "bad" readers relative to any external standard since there are no standardised tests of reading available for the population. It would, obviously, be inappropriate to assess pupils in Zambia on tests standardised in Britain.
One approach to establishing guide lines for the interpretation of results is to ask the pupils' class teachers to examine the tests and to estimate what they feel the average pupil will get (not should get) on the 60 item test. This was done, with the following results:
Pooled Teacher Judgements on Word Find
|
|
Urban |
Rural |
|
Number of Teacher |
Number of Teacher |
|
|
Judgements: 5 |
Judgements: 6 |
|
|
Year |
Mean Judgement |
Mean Judgement |
|
3 |
20 |
21 |
|
4 |
32 |
21 |
|
6 |
53 |
42 |
While this procedure indicates the teachers' judgement of the pupils' ability it does not establish any relationship between score and degree of comprehension. Indeed any attempt to establish such a relationship is ultimately subjective. However, while it would be wrong to arbitrarily fix a test score below which there is no comprehension, and above which there is comprehension, it is permissable to identify a score below which there is inadequate comprehension. (Such a procedure does not necessarily imply that scores immediately above the point selected constitute adequate comprehension.)
Since the three 20 item subtests in Word Find are aimed at three different years (3, 4 and 6) and each subtest is based on the language in the relevant course book (and accepted as such by the teachers), then I would suggest that to score less than 40% on a subtest (ie less than 8 out of 20 items) indicates inadequate reading on that subtest. Obviously setting criterion measures in a subjective manner may be criticised, but an "inadequate comprehension" point of 7 or less out of 20 for these subtests appears to be a generous judgement (and one supported by all British colleagues and Zambian teachers who saw the tests). It would seem difficult to maintain that a person who scores 7 or less out of 20 in these subtests has adequately comprehended them.
In examining the results then, we need to bear in mind the different sources of the scores (in other words which of the three subtests, namely items 1-20, 21-40, 41-60 the correct items come from). The reason for this is that random completion of the items would yield by chance a score of two and two thirds on each of the three 20 item subtests, making a total of 8 for the test as a whole (Department of Applied Statistics, Reading University). For pupils scoring close to 8 then, one should look at where those correct items come from. If they are concentrated in the first twenty items, then we might imagine a slow reader, but one who is giving some evidence of comprehension. If the correct answers are randomly scattered throughout the 60 items, then it is likely that the pupil is guessing. A full description of the Word Find results appears in Appendix I.
7.2.1. The results by school and year are provided in Table 1. Schools J and T are urban schools in Lusaka. Schools C, D and K are rural schools in the North East province.
Table 1: Results by Year and School, Zambia
|
OBS |
YEAR |
SCHOOL |
N |
MEAN |
SD |
MAX |
MEDIAN |
MIN |
|
1 |
3 |
C |
39 |
2.2051 |
2.1665 |
7 |
1.0 |
0 |
|
2 |
3 |
D |
10 |
2.8000 |
2.3944 |
6 |
1.5 |
0 |
|
3 |
3 |
J |
35 |
13.7714 |
10.9788 |
43 |
11.0 |
1 |
|
4 |
3 |
K |
34 |
3.6176 |
2.8921 |
11 |
3.0 |
0 |
|
5 |
3 |
T |
33 |
0.9697 |
0.9180 |
3 |
1.0 |
0 |
|
6 |
4 |
C |
37 |
7.3784 |
3.5540 |
14 |
7.0 |
1 |
|
7 |
4 |
D |
18 |
6.9444 |
7.0166 |
26 |
6.0 |
0 |
|
8 |
4 |
J |
34 |
21.7647 |
15.8861 |
53 |
15.5 |
3 |
|
9 |
4 |
K |
25 |
11.7200 |
7.3230 |
28 |
8.0 |
2 |
|
10 |
4 |
T |
34 |
7.6471 |
3.9380 |
16 |
7.0 |
2 |
|
11 |
6 |
C |
24 |
18.8750 |
10.4354 |
41 |
17.0 |
1 |
|
12 |
6 |
D |
36 |
25.1944 |
10.7247 |
46 |
27.5 |
4 |
|
13 |
6 |
J |
30 |
45.3667 |
9.2270 |
57 |
46.5 |
11 |
|
14 |
6 |
K |
33 |
25.7879 |
8.5138 |
48 |
27.0 |
5 |
|
15 |
6 |
T |
30 |
24.2333 |
14.1267 |
60 |
24.5 |
3 |
7.2.2. Teacher Estimate Scores and Actual Mean Scores
The pooled judgements of the 5 urban teachers (for urban pupils) and 6 rural teachers (for rural pupils) compared with the actual school mean scores (to the nearest whole number) were:
|
ESTIMATES |
ACTUAL MEANS |
||||||
|
Year |
Urban |
Rural |
Urban |
Urban |
Rural |
Rural |
Rural |
|
Tchrs |
Tchrs |
Sch J |
Sch T |
Sch C |
Sch D |
Sch K |
|
|
3 |
20 |
21 |
14 |
1 |
2 |
3 |
4 |
|
4 |
32 |
21 |
22 |
8 |
7 |
7 |
12 |
|
6 |
53 |
42 |
45 |
24 |
19 |
25 |
26 |
It is noticable that the teachers' estimates are well above the actual scores achieved for their category of pupil. This is particularly noticable for Years 3 and 4. Urban School J is the only school that approaches the teachers' pooled judgement, and is in fact comparable to the estimate of rural teachers for their own pupils. From this one may conclude either that teachers are not aware of their pupils' limitations, or that, despite the instructions, they estimated what they considered the pupils should score, rather than what they would score.
7.3.1. Looking at overall scores can be misleading because of the possibility of pupils scoring 8 correct by random completion. It is more instructive to look at the breakdown of scores by subtest. Each subtest, it will be recalled, is based on the material covered in coursework as follows:
|
|
|
|
Material from: |
|
Subtest 1 |
Items 1-20: |
Year 3 |
(Years 2 and below) |
|
Subtest 2 |
Items 21-40: |
Year 4 |
(Years 3 and below) |
|
Subtest 3 |
Items 41-60: |
Year 6 |
(mainly Years 6 and below) |
7.3.2. Subtest 1 (Items 1-20)
Table 2: Scores on Items 1 - 20 by School and Year
|
OBS YEAR |
SCHOOL |
N |
MEAN |
SD MAX |
MEDIAN |
MIN | ||
|
1 |
3 |
C |
39 |
1.7692 |
1.92575 |
7 |
1.0 |
0 |
|
2 |
3 |
D |
10 |
2.8000 |
2.39444 |
6 |
1.5 |
0 |
|
3 |
3 |
J |
35 |
8.6286 |
6.32030 |
20 |
7.0 |
0 |
|
4 |
3 |
K |
34 |
3.0294 |
2.22227 |
8 |
2.5 |
0 |
|
5 |
3 |
T |
33 |
0.9697 |
0.91804 |
3 |
1.0 |
0 |
|
6 |
4 |
C |
37 |
4.9730 |
3.31232 |
12 |
5.0 |
0 |
|
7 |
4 |
D |
18 |
5.7222 |
5.62354 |
17 |
4.0 |
0 |
|
8 |
4 |
J |
34 |
11.0000 |
6.89312 |
20 |
11.0 |
1 |
|
9 |
4 |
K |
25 |
6.0800 |
5.29874 |
17 |
3.0 |
0 |
|
10 |
4 |
T |
34 |
4.1176 |
2.23965 |
9 |
4.0 |
0 |
|
11 |
6 |
C |
24 |
9.4583 |
5.14130 |
19 |
11.0 |
1 |
|
12 |
6 |
D |
36 |
13.0833 |
4.85431 |
20 |
14.0 |
3 |
|
13 |
6 |
J |
30 |
18.4667 |
2.73840 |
20 |
19.0 |
5 |
|
14 |
6 |
K |
33 |
13.6061 |
3.71601 |
18 |
14.0 |
3 |
|
15 |
6 |
T |
30 |
12.6333 |
6.15032 |
20 |
14.5 |
2 |
If it is accepted that to score less than 8 on one's "relevant" subtest or those below, indicates less than adequate comprehension, then the mean scores on the first 20 items for Year 3 in all schools except School J give cause for concern in that they are well below 8. In fact, with the exception of Schools J and K, none of the maximum scores for Year 3 on these first 20 items is over 7.
Leaving aside School J, examination of individual scripts reveals that of a total of 116 pupils in the other four schools' Year 3 classes only 1 pupil (the top scorer in School K) scored 8 or more on the first 20 items. The figure for School J was 16 pupils out of 35 scoring 8 or more. On this evidence about 85% of all Year 3 pupils tested do not appear to have adequate reading comprehension in English at this level.
The situation is little improved in Year 4 where again only School J has a mean of over 8 on the first 20 items although the maximum scores for all schools are well above 8, indicating that certain individuals are coping adequately. In all, 43 Year 4 pupils (including 20 from School J) out of a total of 148 scored 8 or over on this first subtest. This suggests that 70% of Year 4 pupils do not have adequate comprehension at this level.
It is only when we look at Grade 6 that the mean for each school is above 8 correct items. In all 103 out of 153 scored 8 or over on this section suggesting that 23% do not have adequate comprehension at this level.
7.3.3. Subtest 2: Items 21-40
Table 3: Scores on items 21 - 40 by School and Year
|
OBS YEAR |
SCHOOL |
N |
MEAN |
SD MAX |
MEDIAN |
MIN | ||
|
1 |
3 |
C |
39 |
0.3590 |
0.77755 |
3 |
0.0 |
0 |
|
2 |
3 |
D |
10 |
0.0000 |
0.00000 |
0 |
0.0 |
0 |
|
3 |
3 |
J |
35 |
3.4286 |
4.77300 |
16 |
2.0 |
0 |
|
4 |
3 |
K |
34 |
0.3529 |
1.15161 |
6 |
0.0 |
0 |
|
5 |
3 |
T |
33 |
0.0000 |
0.00000 |
0 |
0.0 |
0 |
|
6 |
4 |
C |
37 |
1.5405 |
1.32486 |
5 |
1.0 |
0 |
|
7 |
4 |
D |
18 |
0.8889 |
2.24628 |
9 |
0.0 |
0 |
|
8 |
4 |
J |
34 |
7.2647 |
6.40695 |
20 |
6.5 |
0 |
|
9 |
4 |
K |
25 |
2.4000 |
2.56580 |
10 |
2.0 |
0 |
|
10 |
4 |
T |
34 |
2.1765 |
1.74895 |
6 |
2.0 |
0 |
|
11 |
6 |
C |
24 |
5.5000 |
3.77636 |
13 |
5.5 |
0 |
|
12 |
6 |
D |
36 |
7.5556 |
4.99396 |
18 |
8.0 |
0 |
|
13 |
6 |
J |
30 |
16.7000 |
3.34406 |
20 |
17.0 |
6 |
|
14 |
6 |
K |
33 |
8.0000 |
4.01559 |
18 |
8.0 |
0 |
|
15 |
6 |
T |
30 |
7.5667 |
5.03562 |
20 |
7.0 |
0 |
For these 20 items (21-40) none of the Year 4 mean scores are over 8, although School J is close. Examination of individual scores shows that in all 17 Year 4 pupils (including 15 from school J) scored 8 or over on this subtest out of a total of 148. Again this suggests inadequate comprehension on the part of 88.5% of Year 4 pupils tested, on material which is intended to be appropriate for their level.
In fact, only Year 6 in School J has a mean score of over 8 on this subtest. However maximum scores in all Years 6 are well over 8, and inspection of individual scores reveals that 87 out of 15 3 scored 8 or over, suggesting that only 43% of Year 6 pupils have inadequate comprehension on this subtest.
Year 3 pupils, as one would expect, have scored extremely low.
7.3.4. Subtest 3: Items 41-60
Table 4: Scores on items 41 - 60 by School and Year
|
OBS YEAR |
SCHOOL |
N |
MEAN |
SD MAX |
MEDIAN |
MIN | ||
|
1 |
3 |
C |
39 |
0.0769 |
0.26995 |
1 |
0.0 |
0 |
|
2 |
3 |
D |
10 |
0.0000 |
0.00000 |
0 |
0.0 |
0 |
|
3 |
3 |
J |
35 |
1.7143 |
2.12231 |
7 |
1.0 |
0 |
|
4 |
3 |
K |
34 |
0.2353 |
0.78079 |
4 |
0.0 |
0 |
|
5 |
3 |
T |
33 |
0.0000 |
0.00000 |
0 |
0.0 |
0 |
|
6 |
4 |
C |
37 |
0.8649 |
1.47502 |
6 |
0.0 |
0 |
|
7 |
4 |
D |
18 |
0.3333 |
1.02899 |
4 |
0.0 |
0 |
|
8 |
4 |
J |
34 |
3.5000 |
4.52769 |
15 |
2.0 |
0 |
|
9 |
4 |
K |
25 |
3.2400 |
2.71232 |
11 |
3.0 |
0 |
|
10 |
4 |
T |
34 |
1.3529 |
1.47468 |
5 |
1.0 |
0 |
|
11 |
6 |
C |
24 |
3.9167 |
2.68517 |
9 |
3.5 |
0 |
|
12 |
6 |
D |
36 |
4.5556 |
2.43128 |
11 |
4.0 |
0 |
|
13 |
6 |
J |
30 |
10.2000 |
4.55162 |
17 |
11.0 |
0 |
|
14 |
6 |
K |
33 |
4.1818 |
2.49317 |
12 |
4.0 |
0 |
|
15 |
6 |
T |
30 |
4.0333 |
5.00678 |
20 |
3.0 |
0 |
For the last 20 items (41-60) only Grade 6 in school J has a mean of over 8, although yet again individuals in other schools appear to be coping, notably one boy in School T who scored full marks on the test (and 58 on the Nyanja test). Altogether 40 Year 6 pupils (including 24 from school J) scored 8 or over on this subtest, suggesting that some 74% are having difficulty with comprehension at this level.
Year 3 scores are very low on this section, as one would predict, while only 8 Year 4 pupils (2 from school K, 6 from School J) have 8 or over.
The majority of pupils in Year 3 and Year 4 appear to have inadequate comprehension according to tests which are based on their course books, and which teachers judged they should be able to cope with. Approximately three quarters of Year 6 pupils are having difficulty with comprehension of material judged to be at their level, although most appear to be able to cope adequately with material from Years 3 and 4. However it is difficult to see how the majority could learn through reading in English in their other subjects, as they are supposed to be doing. It is also likely that the majority of Grade 6 pupils will be unable to improve sufficiently over the next year to have any chance of a reasonable performance in the Grade 7 leaving examination, which appears to make far heavier demands on their English reading ability than does Word Find.
These results are in line with earlier research carried out in Zambia. Serpell (1978) points out that in McAdam's 1973 comparative study of English medium (ZPC) versus Zambian language medium classes, the English test scores were bimodally distributed with about half the English medium grade 4 pupils scoring as poorly on the English tests as the Zambian medium pupils. Serpell comments that "the gross retardation of this large group of ZPC pupils seems to be due to a failure in learning to read in English" (Serpell, 1978: 433).
Sharma (1973) administered a 40 word recognition test in English to 3,298 grade 3 children (a 5% sample). The words were drawn from ZPC coursebooks at grades 1, 2 and 3. Only 4.15% could read all the words correctly, while 5.36% could not read a single word. Only 17% of these grade 3 children managed to read all the grade 1 words correctly, while only 7.2% could read all grade 1 and 2 words correctly.
Chikalanga (1990) describes a study by the English Department of the Kitwe Teachers' College which in 1973 examined 583 grade 5 children on a test of 100 words randomly selected from grades 1 - 5 of the ZPC books. The conclusion was that "there is a large group of very poor readers in most classes and they are unlikely to be able to cope with the English course of the New Zambia Primary Course nor be able to do much of the work in other subjects" (Chikalanga, 1990:69).
It is clear that the overall results in the present study, weak though they are, receive a boost from the presence of School J. If this school is unique, then the picture in Zambian primary schools overall is extremely bleak. The opinion of many experts in Lusaka was that the school is good, but not the only one of its quality.
While it would be inappropriate to go into detail as to the relative facility of the Nyanja test and the English test, or the relative difficulty of the Nyanja subtests in comparison with each other, it is worth noting the actual scores on the Nyanja test compared with the estimates. It is also of interest to compare the results and examine the nature of the correlation between the scores in English and the scores in Nyanja of the same pupils.
Only 1 teacher estimated urban scores in Nyanja, and 5 teachers estimated rural scores. Means are given to the nearest whole number. The test contained 60 items.
Teacher Estimate Scores for Nyanja. V01
|
ESTIMATES |
ACTUAL MEANS |
||||||
|
Year |
Urban |
Rural |
Urban |
Urban |
Rural |
Rural |
Rural |
|
Tchrs |
Tchrs |
Sch J |
Sch T |
Sch C |
Sch D |
Sch K |
|
|
3 |
30 |
21 |
6 |
2 |
4 |
1 |
2 |
|
4 |
40 |
20 |
10 |
5 |
8 |
10 |
3 |
|
6 |
53 |
35 |
16 |
17 |
20 |
24 |
31 |
Again the actual scores are far below those predicted by the teachers. It appears that School J in Year 6 is no longer superior. This is not surprising in view of the fact that some two thirds of pupils did not claim Nyanja as a home language. Moreover, my information was that Zambian languages are in practice largely ignored in Lusaka schools.
These results indicate that a substantial number of rural pupils in Year 3 and 4 appear to have great difficulty in reading Nyanja (which nearly all claimed as their mother tongue).
It would seem then, that a great number of Year 3 and Year 4 pupils in Zambia have inadequate reading ability in both English and their mother tongue. These results would certainly not lead one to conclude that the children can actually read, but perform badly in English only because of language problems. It is possible that the variety of Nyanja used in the test was unfamiliar to the children, but no teacher made any comment to this effect.
It seems clear that the policy of instruction in English from Grade 1 has a negative effect upon literacy in the mother tongue. The situation in Malawi, where Chichewa is the medium of instruction for the first 4 years, suggests that children can achieve reasonable literacy in their mother-tongue with no adverse effect on their English. On the current Zambian policy, I would endorse the views expressed in Focus on Learning (MOE, 1992), paragraph 5.4:
"Too early an emphasis on learning through English means that the majority of children form hazy and indistinct concepts in language, mathematics, science and social studies. A number of studies in Zambia have confirmed that children's subsequent learning has been impaired by this policy. The use of English, to the exclusion of local languages, as the medium of instruction in schools leads to a downgrading of these languages.The "English equals education" mentality does little foster an appreciation for one's cultural heritage."
Product moment correlations of scores in English and Nyanja were carried out. In Years 3 and 4 they reveal low positive correlations of low statistical significance for the most part. Since the scores in these years tend to be low in any case, they do not merit any special attention. Of more interest is the correlation of scores in Year 6.
Table 5: Correlations of Scores in English and Nyanja, Year 6
|
School C |
(rural) |
0.82467 |
(p<0.0001) |
|
School D |
(rural) |
0.73068 |
(p<0.0001) |
|
School K |
(rural) |
0.77876 |
(p<0.0001) |
|
School J |
(urban) |
0.56686 |
(p<0.0011) |
|
School T |
(urban) |
0.67354 |
(p<0.0001) |
Correlations of English scores and Nyanja scores in Year 6 yielded results of 0.7 or over with high statistical significance (at 0.0001) in all rural Zambian Year 6 classes. This means that there is a strong tendency in those schools for pupils who score relatively well in English to score relatively well in Nyanja and vice versa. This suggests that there may be an underlying "literacy" factor, in that not only does the English performance improve relatively in the sixth year, but the same pupils who improve in English also tend to be those who improve in Nyanja.
7.7.1. The influence of these factors on Word Find results has been calculated through statistical procedures, using the MIXED procedure from the computer package SAS. A detailed account appears in Appendix K.
7.7.2. Sex differences
Overall there is little evidence of differing achievement by the two sexes. Girls are estimated to score 1.2 marks more than boys overall on the English test, but this is not statistically significant. Girls again have an advantage of 0.2 marks in the Nyanja test, but again this is non-significant.
7.7.3. Urban/rural differences
The estimated differences in score between urban and rural schools for English is large at 7.2 marks, but this is not significant. The problem is the relatively small number of schools involved. It is possible that real differences between urban and rural schools do exist for English, but a larger sample of schools (not pupils) would be needed to confirm this.
Interestingly, on the Nyanja test rural schools are estimated to score 1.75 more than urban schools, but for the same reason this is not statistically significant. Again, there may be a real difference here, for one might expect children from rural Nyanja speaking areas to be more familiar with the language than urban children, many of whom come from a non-Nyanja speaking home background (in urban school T approximately half of the pupils do not have Nyanja as a home language, while this is the case of approximately two thirds of children in urban school J).
7.7.4. Year differences
Estimated differences between years 3, 4 and 6 are large and strongly significant, indicating a progressive improvement in ability with length of schooling for performance in both English and Nyanja. This is reassuring in that it indicates children are actually learning more the longer they stay in school.
7.7.5. Home Language differences (Nyanja test only)
On the Nyanja test children from Nyanja speaking homes are estimated to achieve 0.42 marks more than children from non-Nyanja speaking homes. However, although it is in the expected direction, this difference is far from statistically significant.
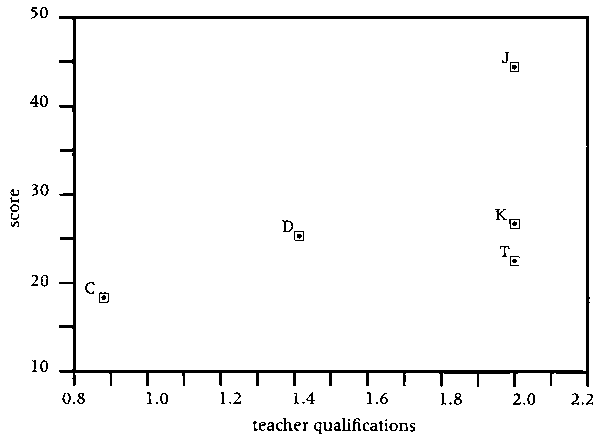
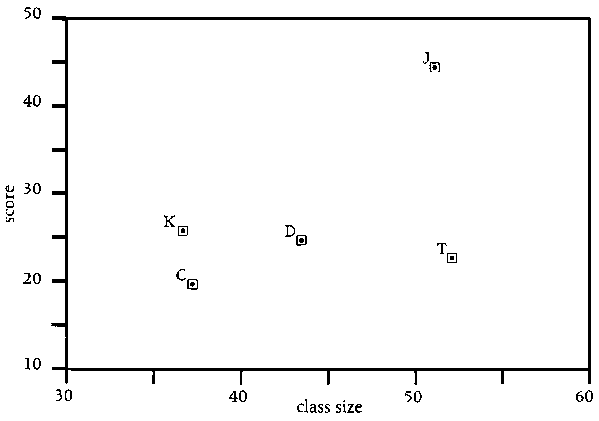
7.8.1. The factors that are considered here are books per pupil, class size and teacher qualifications in relation to mean scores on the Word Find reading test at Grade 6. The results are presented statistically through computed means, and also visually through scattergrams. The results are suggestive, but not conclusive, partly because the number of schools is small, partly because the difference between the mean scores at Grade 6 is very small in the case of 3 schools, and partly because the differences within the other factors is probably not sufficient to give rise to clear effects. It is also likely that the factors interact with each other, in a way that will not be readily apparent in a simple one factor comparison. Needless to say, no claim for statistical significance is made.
7.8.2. Relationship between Books per pupil (Grades 1-6) and Mean Scores in Grade 6
Here the mean number of English books per pupil over all pupils from Grade 1 to Grade 6 is computed.
|
School |
Gd 6 Mean |
Books |
|
J |
45.37 |
0.79 |
|
K |
25.79 |
0.42 |
|
D |
25.19 |
0.28 |
|
T |
24.23 |
0.16 |
|
C |
18.88 |
0.44 |
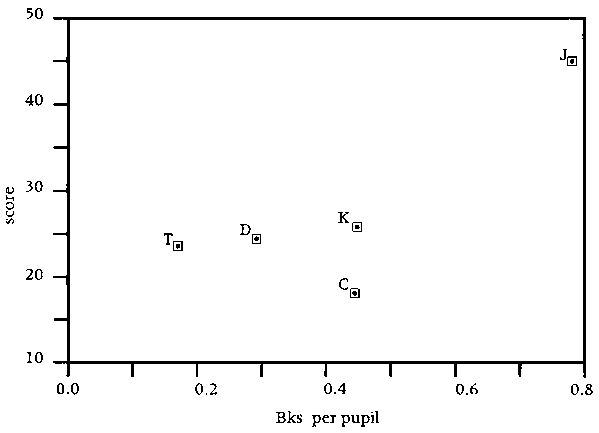
With the exception of school C there is a tendency for score to increase with an increase in books, which is what one would expect. Note that in School J pupils have almost one book each.
7.8.3. Relationship between Mean Class Sizes (Grades 1-6) and Mean Score at Grade 6
The class mean size is computed for all classes from Grades 1 to 6, although of course it is not known how big past classes of pupils currently in grade 6 were.
|
School |
Gd 6 Mean |
Mean Class |
| J | 45.37 | 50.83 |
|
K |
25.79 |
35.66 |
|
D |
25.19 |
43.66 |
|
T |
24.23 |
51.83 |
|
C |
18.88 |
36.33 |
This presents an inconclusive picture with School J which has large classes achieving high test scores, while School C with small classes has a low mean test score. It certainly suggests that a class size per se (at least if limited to 50) does not have a determining effect on achievement.
7.8.4. Relationship between Teacher Qualifications and Mean Score at Grade 6
The mean teacher qualification score is arrived at by giving two marks for each qualified teacher, and 0 marks for an unqualified teacher for all teachers at and below Grade 6, and dividing the result by the number of teachers.
|
School |
Gd 6 Mean |
Tchr Mean |
| J | 45.37 | 2.00 |
|
K |
25.79 |
2.00 |
|
D |
25.19 |
1.40 |
|
T |
24.23 |
2.00 |
|
C |
18.88 |
0.88 |
While not conclusive, the results are suggestive. There is a tendency for schools with better qualified teachers to achieve higher means at Grade 6. Of course, it is not known how long the current situation has been the case in these schools (ie whether in previous years there were more or fewer qualified teachers).
![]()
![]()
![]()