![]()
![]()
![]()
Achieving the targets: the scale and geography of the challenge
Barriers to UPE and gender equality
2.1 Reliable data on school enrolment are not universally available15, but the Education for All 2000 Assessment16 estimates that 113 million children, 60% of them girls, are not enrolled in school. Over 40 countries report net primary enrolment rates of below 80% (Annex 1). Indicators of school attendance, retention and attainment are even more difficult to obtain, but it has been estimated that in sub-Saharan Africa, one third of children enrolled in primary school drop out before reaching the fifth grade17.
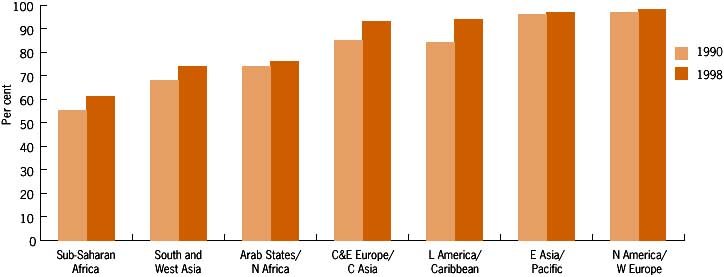
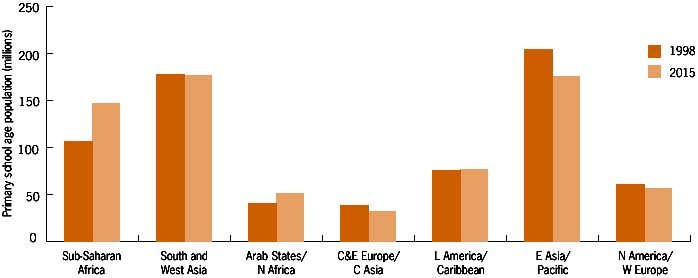
15 There are confusing discrepancies between education statistics presented for countries which it has not been possible to avoid in this paper. The UNESCO Institute for Statistics has the international mandate for collecting and disseminating education data. Other international bodies present some data from their own sources and sometimes use different definitions, for example on primary school age boundaries, regional groupings and the estimation of missing data. In addition, the figures supplied by member states to UNESCO for the Education for All 2000 Assessment do not fully correspond with other national data. In particular, in some cases, the population estimates they give differ significantly from the population estimates produced by the United Nations Statistical Department which are otherwise routinely used.2.2 Despite the question mark over the validity of the data, it is clear that the magnitude of the challenge of UPE is greatest in sub-Saharan Africa, where net enrolment rates are lowest (61%) and 42 million of the 113 million out-of-school children live, and in South and West Asia with 47 million (Figure 1). Africa also faces a large projected increase in primary school age population (37%18) between 1998 and 2015, while a stable demand for education is expected in Asia (Figure 2). In both regions, there is a strong correlation between low enrolment and the incidence of poverty.16 International Consultative Forum on Education for All (2000) Statistical Document Education for All 2000 Assessment. Paris: UNESCO
17 UNICEF (1998), State of the World’s Children. New York: UNICEF. Also see Annex 2.
18 All projected changes in population are from the ‘medium variant’ in the UN’s World Population Prospects: the 1998 Revision. They project recorded trends in fertility and mortality. The projections also take account of estimated and projected levels of HIV/AIDS prevalence in countries and make assumptions about the impact this will have on the size of population.2.3 In sub-Saharan Africa, population growth and an increase in the proportion of the population which is very young and economically dependent, set a daunting demographic challenge. Governments are faced with the problem of educating an ever-growing school population within tightly constrained budgets. To achieve UPE will require major and sustained increases in enrolment, year on year, akin in some countries to the rapid expansion that took place in the post-independence years of the 1960s. Maintaining progress will be a major task, unless fertility rates, in part a consequence of a failure to retain girls in school, fall substantially in the early years of the new millennium.
2.4 In South and West Asia, while there are still nearly 50 million children out of school, primary enrolment is approaching 75%, and the demographic picture is less daunting. In India, for example, the school age population is projected to remain at about the current level, but the proportion of the population which is economically active will increase, thus reducing the dependency ratio, and potentially making more resources available for education.
Figure 1: Primary net enrolment rates
Figure 2: Projected changes in primary school age population: 1998 to 2015
2.5 In the Arab States and North Africa the annual average demographic growth rate is 2.5% per annum. To attain an 80% enrolment rate by 2010 will require that primary education opportunities be made available for an additional 29 million students; this in the context of many countries being afflicted by conflict. In South East and East Asia, declining fertility rates in China should result in a major decline in the school age population by 2015, from 220 million to an estimated 183 million, although this projection may underplay the circumstances of minority groups. In Latin America and the Caribbean, it is the slow expansion of secondary education that represents a significant brake on the pace of development. In the island states of the Pacific primary enrolment is high, and the main issues are quality, equity and the expansion of secondary and higher education.
2.6 Assessment of the effectiveness of primary education and the quality of learning outcomes is difficult, although rates of drop-out from school, the proportion of pupils who have to repeat years, rates of primary completion and transition to secondary education, are useful proxy measures. A recent survey19 of 58 countries showed that, in 23 of them, more than 20% of children enrolling in the first year of primary school failed to complete four years of education. Completion rates of the full primary cycle in most countries in sub-Saharan Africa are between 60-70%. And there are significant in-country disparities that reflect inequalities in access and provision of schooling. Africa also has some of the lowest transition rates to secondary education, many below 10%. Two thirds of all African countries have gross enrolment rates in the secondary sector of below 40%.
19 International Consultative Forum on Education for All (2000), Education for All 2000 Assessment: Statistical Document. Paris. UNESCO2.7 The gender gap is most pronounced in sub-Saharan Africa and South and West Asia (Figure 3). Of the 25 countries worldwide with the poorest girl: boy ratios in primary and secondary education, 17 are in sub-Saharan Africa. In 1998, 54% of school age girls in sub-Saharan Africa were enrolled in primary school, compared with 66% of boys. The comparable figures in South and West Asia were 67% and 79%. In most high-income countries and Eastern Europe there is near parity of enrolment, and arelatively small difference in Latin America and the Caribbean. At the secondary level there is growing parity between girls and boys who are enrolled (South and West Asia is lowest with 40%) but the actual percentage of school age girls who pursue secondary education remains low as Table 2 shows.
Table 2 Secondary school gross enrolment ratio: 1990-1996
|
|
Male |
Female |
|
Sub-Saharan Africa |
27 |
22 |
|
The Middle East and North Africa |
64 |
54 |
|
South Asia |
52 |
33 |
|
East Asia and Pacific |
67 |
61 |
|
Latin America and the Caribbean |
48 |
52 |
|
CEE/CIS and Baltic States |
82 |
82 |
|
Industrialised Countries |
105 |
107 |
|
World |
61 |
54 |
Source: see Annex 12.8 Globally the gender gap has been closing. However faster progress in sub-Saharan Africa, South Asia and the Arab States is required if the 2005 target of parity is to be met, as the gradient on the regional curves on Figure 3 demonstrate.
2.9 According to figures from the United Nations Educational, Scientific and Cultural Organisation (UNESCO)20, the total number of adult illiterates (men and women over the age of 15) fell from an estimated 962 million in 1990 to 887 million a decade later. Despite this, over one in five adults is illiterate in the year 2000 and the majority of these are women. Regionally, Eastern and Southern Asia combined have an estimated 71% of the world’s illiterates. This literacy gap is an enormous barrier to sustainable development and is compounded by the very substantial gender gap in adult literacy (Figure 4). And illiteracy in rural areas is more than twice as high as urban areas.
20 Quoted in International Literacy Institute (2000), Education for All Thematic Study on Literacy and Adult Education. A Thematic Study for the Education for All 2000 Assessment. Paris. UNESCO.
Poverty heightens educational disadvantage
2.10 In the countries with the worst education indicators, most children from the poorest households have no primary education. Households with limited education are more likely to be poor. The gaps between the attainment of rich and poor children can be enormous. In India, for example, 15 to 19 year olds from the richest 20% complete on average 10 school grades more than the equivalent cohort amongst the poorest 40% of students.21 In Senegal, the enrolment of 6 to 14 year-olds from the poorest households is half that of children from the richest households. Of the children who do enrol, it is the poor who overwhelmingly drop out of school.
21 World Bank (1999), Poverty Trends and Voices of the Poor. Washington: World Bank.Figure 3: Girls as a percentage of boys in primary and secondary school(1)
(1) Ratio of girl’s gross enrolment for primary and secondary education, expressed as a ratio of the corresponding figure for boysFigure 4: Gender equality in adult literacy(1)
(1) Ratio of girl’s gross enrolment for primary and secondary education, expressed as a ratio of the corresponding figure for boys2.11 For the poorest households, education may be a lesser day-to-day priority than basic survival. In cases of extreme poverty, children may contribute up to 40% of family income. Girls in particular contribute unpaid labour, mainly in domestic and agricultural activities. Thus direct and indirect costs can make education prohibitively expensive, while lack of access to a school or the poor quality of education on offer may discourage those parents who might have been willing to bear these costs. Where poor children do manage to enrol in school, poor nutrition and health can hinder their full participation and learning.
2.12 Formal education systems are often inefficient in recognising and addressing the special circumstances of working children. The International Labour Organisation (ILO)22 estimates that there are up to 250 million children working full or part-time in the developing world. UNICEF23 estimates that 140 million of these are between the age of 6 and 11. Around 23% of these children enrol at school but 77% of those subsequently drop out.
22 International Labour Organisation, Bureau of Statistics (1996), Geneva.Gender inequality results in widespread educational disadvantage23 UNICEF (1998), State of the World’s Children. New York: UNICEF.
2.13 In most societies, men and women differ in the activities they undertake, their access to, and control of, resources, and in participation in decision-making24. The position of women is often characterised by unequal power relations, limited mobility, restricted access to political power, confinement to domestic and subsistence spheres and inequality before the law.
24 DAC (1998), DAC Guidelines for Gender Equality and Women’s Empowerment in Development Co-operation. Paris. OECD2.14 Girls contend with a complex mix of barriers to their right to education. Patriarchal systems of social organisation, a high value on women’s reproductive role linked to customary early marriage (and pregnancy), and relatively low regard for the value of female life in some societies, are all formidable obstacles. Poor parents may not be willing to incur the direct and opportunity costs of educating their children, particularly girls. Where decisions to send children to school are weighed against labour contributions, girls are often the last to be sent to school and the first to be withdrawn. Parents sometimes anticipate that their investment in a daughter’s education will be lost when she marries into another family. Girls who do go to school are more likely to be withdrawn for seasonal labour. Legal inequalities, the lack of female role models and limited job opportunities for women, allied to the lack of policies to eliminate gender discrimination within schools and more widely, compound the range of challenges confronting girls.
2.15 Of the 880 million illiterate adults, some 600 million are women. This is a direct consequence of their not having been able to benefit from a primary education. The prevalence of female illiteracy is a good guide to gender inequality at school level and the disadvantage of girls.
2.16 Thus, home background has a strong influence on opportunity at school. Illiterate parents are severely disadvantaged in assisting their children in developing literacy and numeracy skills. Those who have been excluded from educational opportunities themselves may have had less opportunity to assess its potential for their children. Research studies indicate that women participating in adult literacy programmes are more likely to send their children to school and keep them there, than illiterate mothers. They are also more likely to encourage their children to read and study at home25.
25 World Bank (1999), Education Sector Strategy. Washington: World Bank.Social exclusion denies the possibility of UPE
Minorities and socially excluded groups
2.17 Exclusion from education takes many forms. Children may be disadvantaged due to their class or caste, or because they belong to an ethnic, linguistic, cultural or religious minority. Migrant families and nomadic communities face specific difficulties. In multi-language societies, the choice of language for initial instruction may privilege majority groups, either more numerous or more powerful, and disempower minorities.
Children with disabilities
2.18 Children with disabilities have the same right to education as other children, and these are enshrined in the Convention on the Rights of the Child. While education data on children with physical or learning disabilities are poor, it is clear that very few, perhaps less than 2% globally, are in school. Boys with disabilities are more likely to attend school than girls. Literacy rates for people with disabilities, particularly women, are very low.
HIV/AIDS is a serious threat to sustainable progress in education
2.19 HIV/AIDS is having a devastating impact on poor people. In sub-Saharan Africa, the UN has declared that it “is a problem that dwarfs all other problems in the region”26. The prolonged sickness, and death, of those infected, in addition to the human tragedy, exacerbates and deepens existing poverty, through the direct costs of illness and the loss of labour. The effect on young adults of child-bearing age has increased the dependency ratios in poor communities and left many children orphaned. At least 95% of AIDS orphans (children who have lost at least one parent) live in Africa. In Zambia, for example, 30% ofchildren are likely to lose at least one parent by 2010. In many countries infection rates continue to increase, and even where these are beginning to be checked (e. g. Uganda) the impact will continue to be severe.
26 Gachuhi, D. (1999), The Impact of HIV/AIDS on Education Systems in the Eastern and Southern Africa Region and the Response of Education Systems to HIV/AIDS. New York: UNICEF.2.20 HIV/AIDS is a very significant challenge to achieving UPE, especially in sub-Saharan Africa. Where traditional community safety nets are disrupted, children may become heads of household, be cared for by relatives or neighbours or be kept at home to care for sick family members. Increasing numbers of children are taking to the streets. Where attendance at school is possible, it is likely to be disrupted, and there is clear evidence of declining attendance rates of girls in particular. These direct impacts, the more pervasive deepening of poverty and the increased sense of irrelevance of much traditional formal schooling in the context of HIV/AIDS, combine to work against progress in education. The impact of HIV/AIDS on performance of education systems is dramatic. High sickness and attrition levels among the teaching force threaten to undermine efforts to improve the quality of schooling.
Conflict threatens educational development
2.21 Conflict has severely disrupted education, particularly in sub-Saharan Africa, but also in Afghanistan, Colombia, the former Yugoslavia and parts of the former Soviet Union. Schools are often targeted and teachers put at risk in conflict situations. The supply of educational materials may be affected along with the disruption of education management, and the school environment may become unconducive to learning. Widespread and severe conflict may result in the collapse of formal education systems; where conflict is confined to a specific part of a country, it will likely result in increased inequity in national development.
2.22 Education may actually contribute to conflict through language policies which discriminate against minorities or through a curriculum which prejudices their standing in society. Unequal national development, including education provision, may also exacerbate conflict in less well served districts.
2.23 The effects of war on children, including massive violations of their rights, are well documented. Children are vulnerable to death, rape, mutilation, unlawful recruitment, displacement and separation from family, disabling injury and malnutrition. Adolescents are at extreme risk; girls are especially vulnerable, as are children with learning disabilities. They may be put at risk of HIV infection. The impacts of conflict can be long lasting and need to be addressed as part of any education programme with war-affected children.
2.24 Globally the number of children who are displaced is around 30 million. In Africa alone, there are over 23 million refugees, returnees and displaced persons. Effective responses which include education require accurate and timely information on war-affected children which is disaggregated by sex and age. There is a lack of a systemic approach to data collection which affects subsequent resource planning and mobilisation.
Addressing the challenge
2.25 The magnitude of the challenges set out here underlines the importance of learning from the experience of governments and funding agencies; both what has worked, and what has not. A number of broad lessons are discussed in the next chapter. Some of these may not, in themselves, appear dramatically new, but it is in their combination that they become important.
![]()
![]()
![]()