![]()
![]()
![]()
2.1 Introduction
2.2 MEASURING THE IMPACT OF EDUCATION IN KENYA
2.3 PERFORMANCE INDICATORS IN THE ANDHRA PRADESH DISTRICT PRIMARY EDUCATION PROJECT
2.4 EDUCATION PERFORMANCE INDICATORS IN A NEW SOUTH AFRICA: A PROGRESS REPORT
ANNEX 2A: Further Proposals for the Development of Educational Performance Indicators in South Africa
2.1.1 The Choice of Case Studies
2.1.2 The Approaches to Evaluation
In the preceding chapter, a number of propositions based on the literature have been developed together with a proposed framework which could eventually be used at the sectoral level at different stages. The purpose of this section of the report is to examine the extent to which these theoretical notions might apply in a number of different contexts.
Three very different contexts have been chosen. In Kenya, independent in 1960, there has been a long-standing ODA/DFID involvement in a variety of education projects ranging from support to self-help school-building to encouraging the development of an indigenous publishing industry. Whilst there has been a general drift towards improving educational management and quality improvement via providing local support to teachers, and towards consolidation within one overall programme, SPRED (Strengthening Primary Education) Phases I and II; there are still clearly distinct components.
In Andhra Pradesh (an average sized Indian state with a population of approximately 60 million), there has been a large scale, state-wide, unified programme since 1984. The programme emphasises combining inputs at the school level and has been implemented using a rolling approach across the state.
Finally, the case of South Africa is seen as being of particular interest because it is newly independent and because of the problems of integrating a large number of pre-existing educational systems into a coherent whole.
In Kenya, evaluation has always been highly contextual. For example, the review of the informal sector by King (1996) was mainly an historical analysis. The evaluation methodologies promoted under SPRED I were highly qualitative without being at all rigorous; and so on. Moreover, the evaluation with SPRED I had been university based even though there had been difficulties in the university during this period.
In Andhra Pradesh, the approach to evaluation has been entirely different with the appointment of external consultants to carry out an ongoing quantitative evaluation. This led to the development of a highly quantitative, formal evaluation scheme with schools being rated on their degree of APPEPness (see Cooper et al, 1996) which was seen as demonstrating the success of the programme, and the extent to which they had absorbed the principal features of the Andhra Pradesh Primary Education Programme). At the same time, it has appeared to generate some internal criticism, possibly through lack of local ownership.
Finally, although there had been a functioning system of education statistics and indicators in South Africa, the form and content of that system was clearly only relevant for the preceding regime. The purpose of the case study here was to examine what kind of performance indicators were being developed in the new situation. Given the embryonic state of development, however, the discussion in section 4 of the situation in South Africa is mostly concerned with what might the implications of developing structures and the extent to which, key actors in the system are aware of the pitfalls of different kinds of data and statistics.
2.2.1. Introduction
2.2.2. Schooling in Kenya
2.2.3. VET in Kenya
2.2.4. Kenyan Data
2.2.5. DFID in Kenya
2.2.6. Concluding remarks
The purpose of this section is to examine, briefly, the sorts of indicators being used by the authorities in Kenya to judge the impact of its educational policies. The chapter starts with a short review of the education system in Kenya, but the reader is referred to a DFID (formerly ODA) publication by Oketch (1995) for a fuller description and review.
Education is not free in Kenya and this leads to considerable hardships, particularly for parents in the poorest categories. This category can reach quite far. For instance, unskilled workers in urban areas earn around Ksh2000 to 3000 per month in 1996 (Ksh80 = £1) and rural workers make do on around Ksh70-80 per day that is when there is work. Costs of sending a child to school vary from Ksh300 to 700 a month. This makes it difficult if not impossible for poor families with four or five children (the norm with population growth running at a high 2.9% p.a.) to send their children to school. And, if a decision is taken to send one child to school, it will usually be male.
Many items (buildings, school meals, books, transport, etc.) are paid for by the parents themselves. Even for handicapped and special needs schools the main financial burden must be carried by the parents. Some contributions are received from outside donors or other institutions for special schools or for schools in the poorest areas, such as the arid regions of Kenya, and for mission schools. There are about 16, 000 primary schools in Kenya, 3, 000 secondary schools, 200 diploma-level colleges and 6 public universities.
The Ministry of Education (MoE) in Kenya concentrates on overall policy development, monitoring of the educational system, planning future expansion based on projected numbers enrolled, training teachers, monitoring examinations and curriculum development. The Ministry of Technical Training co-ordinates vocational and technical training in the country and observes the technical standards and certification set by the Kenyan National Examination Council (KNEC).
The Ministry of Planning and Development also uses data from the MoE to prepare its plans - the most recent development plan covers 1997-2001 (Government of Kenya, 1996a). Currently, too, the MoE is preparing a long-term educational plan over 1997 to 2010. The overall plan focuses upon industrialisation and the objective is to move the economy to the status of an industrialising (not industrialised, note) economy by the year 2020. This will require raising annual savings from the current 17% of GDP to 30%. The Plan does not ignore unemployment and poverty and states that the long term objective of the Government is to reduce these, with youth and other disadvantaged members receiving special attention. It does ignore education: the Plan re-states the Government's guiding philosophy, that every Kenyan has the inalienable right, no matter his or her socio-economic status, to basic education. Yet, the 1997-2001 National Development Plan does not give a high priority to education, particularly to the primary education that is so sorely required.
The main problems of education in Kenya are low quality of instruction, uneven standards, high repetition and dropout rates, especially for girls, declining enrollment rates, and serious inequities in the system. For instance, pupil-teacher ratios in primary education vary from 1: 10 to 1: 70 (World Bank 1997a); and funds are disproportionately allocated - current public expenditure is 57% primary, 16.2% secondary and 20% tertiary while enrolments are 89%, 29% and 2%, respectively. The richest 10% of schools receive more than four times the subsidy from the public purse than the poorest 10%. Due to structural adjustment policies, there has been a reduction in pubic expenditure at a time when cost-sharing by parents has probably peaked (parents simply cannot give any more), and this has created a resource gap that is likely to lead to reductions in educational quality and enrolments (Government of Kenya, 1996b). This can already be seen with the rate of growth of enrolment of 6-14 year-olds being less than 2.5% while the population in that age range is growing at about 3%. For primary education, over 1989 to 1995 enrolments fell from 95% to 79%.
The financing of education has continued to trouble the Government. The Central Government makes substantial inputs to education. Government expenditure doubled over 1992 to 1995, and the expenditure of the Ministries of Education and Research, Technical Training and Technology has been increasing steadily. Currently public expenditure on education is 6.2% of GDP and 38% of total public recurrent expenditure (Abagi, 1997). The Government's Plan states that the policy of cost-sharing between the Government, parents, and communities, which has been in place since 1988, will be maintained. It notes that the bulk of Government subsidies are in the form of teachers' salaries which have led to "problems for poor students who cannot afford to pay for books or equipment" although it will take "measures to rectify these adverse trends" without specifying what they mean. The fact that teachers' salaries are fixed and not based upon delivery has not been addressed. Nor does it take account of the serious problems in the arid and semi-arid areas of the country where education is in competition with survival needs. But the main problem is inefficiency in the allocation of public expenditure to education.
Despite relatively large sums being spent on education, quality is declining and enrolment levels falling.
The ODA financed study by Oketch (1995) is pessimistic that the six major reviews of educational policy in Kenya since independence will be successful. These reviews have suggested alternative models of education and training that culminated in changes in the mid-1980s, introducing, for instance, the 8: 4: 4 system of education. Oketch notes that whilst "the structure and content of the curriculum has been changed to emphasise the learning of practical skills, the strategy is unfortunately based on an inadequate assessment of resources and other important aspects of education such as the ability of the students to learn certain concepts and skills at certain ages or times. The current system was introduced in the absence of teachers with experience and skills in teaching the newly introduced practical skills. The government also ignored or underestimated the cost of financing the teaching of practical subjects in schools."
Kenya's vocational training and technical education system (VET) suffers from some of the same weaknesses that characterise many similar systems in developing countries that have been fostered and financed entirely by the public sector (Kilele and Sinclair, 1991). That is they tend to be orientated toward modern sector employment, provide inflexible training courses with rigid curricula and forms of examination which bear no or very little relation to market demand, and which operate under fixed and inflexible budgets with little to no discretion available to directors of such centres.
There is a bigger demand for VET school places than capacity at the same time as there is a growing problem of educated unemployed; hence a mismatch between skills supplied on the labour market from VET and its demand. Yet VET only accounts for about 3% of public expenditure on secondary education. The system is skewed, too, in favour of science subjects rather than more practical skills required by industry (this is particularly important given that the next national plan proposes a major thrust into industrialisation). This has resulted, for instance, in a current shortage of engineers and a surplus of science graduates.
Observers believe that the imbalance between jobs and the labour force in Kenya will worsen, not improve in the future (Oketch 1995). The Eighth Plan has recognised some of these difficulties and notes that on-the-job training will be emphasised in both public and private sectors given "its superiority to training in formal institutions". A review of the requirements for scientific manpower is planned for the first year of the Plan and the Government intends that its public training institutions will become more "demand driven" with client-centred training to meet the needs of the service and thereby be able to compete effectively with the private sector.
However the information base with which to do this is woefully weak. As the Eighth Plan notes, "there is inadequate data for manpower planning...there is no comprehensive system for monitoring human resource trends...there is no validation mechanism for comparing actual training performance with targets...the occupational classification in Kenyan industry is haphazard and does not adequately take account of changing skills and technology."
In an ODA document produced under the SPRED I project in 1995 (ODA 1995), it was noted that:
The MoE produces vast amounts of data at school level. However its capacity to retrieve and analyse this for the purpose of producing reports on performance, economic planning and improving efficiency is extremely limited. Under the project the MoE has provided a full staff establishment of professional officers in the PU [Planning Unit] to allow analysis of access to education. ODA has assisted with physical resources (computers), staff training (in-country) and specialist expertise for the development and initial operation of an institutional database.The situation has changed little at the time of writing.
National Level Data
In 1993 and 1995, under SPRED I, the Ministry of Education circulated a questionnaire on statistics of primary schools and another one on the statistics of secondary schools. All primary and secondary schools (both public and private) were required to complete the questionnaire. This was in addition to the normal educational census data collected annually (see below). The questionnaire was sent out to assess enrollment, dropout, repetition rates, teachers' qualifications, but also to assess the reasons for dropout or non-enrolment in primary education. Response rates of up to 95% were obtained, yet at the time of writing (March 1998) published results were not available for the 1993 survey, although printouts could be obtained from the MoE on request; and data were still being keyed into a computer from the 1995 returns. Educational census data for 1995 were available, however. Listed below are the categories of data collected for primary and secondary schools.
Table 5: Annual Educational Census Data
|
School type, status, attendance (public/private; mixed, girls only, boys only; day/boarding/day&boarding, if day&boarding number of pupils) Enrolment data (by class, stream, gender and age) Repeaters (by class, sex) School milk receivers? (yes/no, numbers by UHT/pasteurised) School Feeding Programme (yes/no, Programme type by sex) Data on Special Education (school category, type of disability by sex by school category) Teachers (by qualification and gender, age, teaching experience) Teachers by employer (type by sex) Teachers leaving school (by reason, trained/untrained, sex) Examination results (subject, sex, grade in Kenyan Certificate of Primary Education (KCPE), level in Kenyan Certificate of Secondary Education (KCSE) exam) Physical facilities & School Equipment (land size by use/buildings by type, number completed, number under construction, number planned/school equipment by classroom or office, by type, total required, currently available, shortfall; accommodation type) Other facilities (water supply/mode of lighting/mode of cooking/access to health facilities) Grants/Aid (yes/no, by type, amount) School fees paid by parents per student per year (by use, by class) Dropouts and transfers (by sex and class) Reason for dropout (reason by sex) Non-enrolments (reason for non-enrolment by sex) |
Other survey data have been collected as well:
· under the PRISM (Primary School Management) project a questionnaire was sent out in 1995 to all headmasters to assess the quality of in-service training;In addition, DFID has installed a management information system in the polytechnics and these may contain some placement data.· a welfare survey, at the household level, was carried out in 1994 and in 1997 (World Bank 1997b)10; and
· tracer studies were carried out in the early 1980s to measure the impact of VET.11
Education and Employment Data
Table 6 summarises the data available to assess the impact of education on employment- related indicators. (See Chapter 3, section 3.7).
How are education data used by national authorities?
The Ministry of Education uses these data to plan for the level of teacher training required over the coming years, based on projections of school enrollments less dropout and repetition rates. It is also concerned about dropout rates and uses these data to hone its policies. To this end it is currently carrying out a medium-term plan to assess future resource needs. Results are also published in the Government's annual Economic Survey, which has a chapter on education and in the annual Statistical Abstract published by the Central Bureau of Statistics.
Table 6: Education and Employment Indicator Availability
|
|
TYPE OF EDUCATION |
|||
|
Suggested Types of Indicators |
Primary |
Secondary |
VET |
Tertiary |
|
Earnings (wages, other earnings) |
1987 Manpower Survey? |
1987 Manpower Survey? |
|
1987 Manpower Survey? |
|
Rate of return (private and social) |
? |
? |
|
? |
|
Employment status (not in labour force, unemployed,
underemployed, employed) |
1991 Labour Survey? |
1991 Labour Survey? |
|
1991 Labour Survey? |
|
Poverty status (less than food-based poverty,
ultra-poor) |
1992 Welfare Monitoring and Evaluation Survey |
1992 Welfare Monitoring and Evaluation Survey |
|
1992 Welfare Monitoring and Evaluation Survey |
|
Mis-match between job obtained and job for which
qualified |
|
1995 Assessment of Scientific Manpower Req'ments |
|
1995 Assessment of Scientific Manpower Req'ments |
|
Responses from employers on appropriateness of training
received |
|
|
|
Not systematic |
|
Satisfaction gained from work |
? |
? |
? |
? |
An interview at the Ministry of Finance to investigate whether education data are used to prepare the budget showed that this was not the case. Instead, as is done in many countries, the current year's budget is based merely upon the previous year's, using a multiplier, and added to which is an adjustment made for inflation. The Ministry of Education is then given a ceiling within which it must keep. Changes to this are possible in theory, should the Ministry of Education "make a strong case to get more money" but this seems rare in practice.
Plans for improving quality and range of data?
The MoE is aware of the weaknesses in its statistical base. A major problem is that vast data sets are collected but the data are so raw that they need significant processing. This is slow due to lack of motivation of staff and the sheer volume of data. For instance, the primary and secondary school questionnaire in 1995 covered 20 pages and contained about 150-200 data variables. The quality of these data is not as good as it should be because school respondents have no training in filling in the forms, nor do they regard them as a high priority and, in some cases, enrollment numbers are exaggerated to attract more public funds. The same is true of the annual educational census. The MoE would like more funds to train data collectors, to do more than just have telephone contact with District Education Officers (DEOs) and to set up on a regular basis a well organised MIS for educational data. The MoE is also hoping that the World Bank, in a future educational loan, will help them improve their data base. Expenditure data, apparently, are also in disarray. "No established mechanisms exist to capture the entire expenditure in education." (Government of Kenya 1996b)
Data in the VET area are in a worse state. There is no statistical section in the Ministry concerned, despite their needing a proper information system. Nor did it seem that plans were being made to improve the situation.
Plans for using indicators at a sub-national level?
It appears that little use is made of educational statistics to organise the education sector, budgeting is done on a "more of the same" basis. Consequently, sub-national planning is in a worse shape than at the national level and there seemed to be no plans designed to address the situation. In fact Kenya is the only country in East Africa that does not publish education statistics.
With this background, DFID has supported primary education with about £4mn under SPRED I (Strengthening of Primary Education Phase One) over 1992-96, and SPRED II (Strengthening of Primary Education Phase Two) has allocated £18.7mn from 1997-2001 (GoK £16.69mn). The overall goal of SPRED II is to increase demand for and the utilisation of high quality primary education and it will focus on educational outcomes, institutional reform, financial reform, and empowering parents. This focus emerges, in particular, from the fact that over the period of SPRED I primary school enrolments actually declined. An additional amount of £4.6mn has also been allocated to upgrade 15, 000 head teachers through in-service training (the Primary School Management (PRISM) project). DFID has also assisted with the strengthening of the in-service teacher development system through a network of teacher advisory centres (TACs).
A SPRED I evaluation in early 1996 (ODA, 1996) highlighted significant achievements in strengthening the teacher in-service and schools advisory support system. Nevertheless, the evaluation pointed to a need to shift the balance of both programme planning and resources towards school/community levels in order to impact more strongly on the 'achievement culture' of the school. The evaluation proposed a greater focus on TACs as a community education centre, including incentives and mechanisms for greater community participation in the planning and management of teacher development, targeting girls and health/nutrition programmes.
Uses of Indicators in Programme Evaluation
The evaluation report also noted that there was neither a well-defined monitoring programme, nor were the monitoring responsibilities of various parties made clear. Further, the absence of a comprehensive baseline survey was a constant limitation for monitoring progress and impact.
The main indicators identified to measure progress with respect to the SPRED II goal to "increase demand for and utilisation of high quality primary education" are fourfold:
· reduced wastage rates, especially for girls, from the current 56% to less than 30% by 2005;The logical framework also includes a list of 45 further, so-called "measurable indicators" to measure progress on purpose, outputs and activities. Most of them essentially measure inputs. For example, to improve teacher training through the School-Based Teacher Development Programme (STD) would mean, inter alia, testing and measurement booklets prepared for circulation to 175, 000 teachers by KCPE examiners by end of 1997.· improved student performance, raising the average achieved on the Kenyan Certificate of Primary Education (KCPE) by 20 points; and stabilising repetition rates at 15% through to 2005;
· increased gross enrollment rates (GER) from the current 79% to 85% by 2005; and
· increased pupil and parental satisfaction.
The fourth main indicator (pupil and parental satisfaction) is difficult to quantify and measures are not proposed in the logical framework. More precise indicators on the "demand" for education would be useful; and one can note that no links to the labour market are proposed in any of the 4+ 45 indicators.
A Learning Process
According to the evaluators:
"the performance indicators and monitoring mechanisms identified for SPRED are unhelpful... at the top two levels the indicators are given in vague qualitative terms, even for essentially quantitative data. So, for example, an indicator... of 'improved equitable access' is 4.3 Reduction in Gender Differences' [which] may involve gender disaggregation of enrolment statistics, KCPE results, retention or repetition rates, or a qualitative measure such as change in the way teachers interact with pupils of different sexes. Quantified targets for specific measures must be the goal if project description is to be the basis of agreement and implementation activities"(ODA, 1996: 11).
While recognising the difficulty of finding such specific indicators where the objectives are essentially qualitative, the evaluators suggest that more effort should have been made. For example, for the intermediate objective 'institutionalisating the primary level TACs,' the indicators are:
a) TACs working effectivelyThe evaluators comment that the effectiveness of TACs might have been indicated through records of courses and visits; standardised post-training evaluations by teachers; and record of utilisation by teachers of TAC resources.
b) Use of (TAC tutors and subject) handbooks
c) Increased administrative support
They conclude that: "We could not find any evidence that incremental improvement in teaching quality had helped improve enrolment or reduce wastage and repetition. Neither did we identify any parents for whom additional financial demands resulting from SPRED I could be identified as having been the 'last straw'". (ODA, 1996: 36).
However, this appears to be a general lament: indeed, it is curious to note that, despite the evaluator's emphasis on the development of specified indicators, in their own commentary on the impact of sustainability of SPRED they make no reference to the highly quantified and specific targets in SPRED II (focusing on wastage rates, the KCPE average and retention rates, the GER and satisfaction). This is possibly due in part to the difficulties of collecting the appropriate data.
Moreover, the 'lessons' of SPRED 1do not appear to have been learned for SPRED II. The indicators are still as vague as they were in SPRED I:
Purpose 1.1 Teaching and learning environment improved in all districts by 1999, through all teachers using new skills that inspire active learning and through use of textbooks provided under project.
Purpose 1.2 Improved professional support and inspection services to schools nationwide through ungraded and diversified Teachers Advisory Centre (TAC) system and upgraded inspectorate by 2000.
[Taken from their Annex D: this is an early log frame for SPRED II]
In Chapter One, a "generic framework" for defining indicators was presented based on Oakes (1986). Table 7 reviews this framework as applied to the current situation in Kenya.
In conclusion education is well-funded in Kenya but its impact is poor and declining. It would be useful for the Government to use a few benchmark indicators to measure progress of what they actually get out of the approximately 30% of public recurrent expenditure they spend on education. There seems to be no understanding of this at present
Table 7: Generic Indicator Framework Applied to Kenya
|
Indicators must provide at least one of the following
kinds of information: |
And in Kenya? |
|
* a description of performance in achieving desired educational conditions and outcomes * features known through research to be linked with desired outcomes * a description of central features of the system in order to understand its functioning* * problem orientated * policy-relevant |
* the Plan attempts to do this but data are weak * maybe the medium term plan will have some of this but none in evidence to date * this seems to be available * * this doesn't appear to be the case |
|
Indicators should have the following technical
characteristics |
|
|
* ubiquitous features of schooling found in some form throughout the systems/settings being compared * enduring features of the systems so that trends over time can be analysed * feasible in terms of time, cost and expertise * generally accepted as valid and reliable
statistics |
* this is done but problems in organising data at national level * done to a certain extent for basic indicators * expertise is available; resources are the problem * this does not seem to be the case |
2.3.1 The Development of the Project from its Precursors
2.3.2 Quantitative and Qualitative Studies: Project Planning Process
2.3.3 Qualitative Case Studies
2.3.4. Indicators of Implementation
2.3.5. The Overall Effectiveness of the Project
2.3.6 Conclusion
This section is rather different from the others: it reports on the design of performance indicators for the evaluation of a specific project, the Andhra Pradesh District Primary Education Project (APDPEP). First of all, it is important to understand the overall context of the project and then of the design of the evaluation which was intended to generate the maximum possible participation among project beneficiaries. In particular, the evaluation of the previous project in the same state (the Andhra Pradesh Primary Education Project (APPEP) was seen as crucial for both the project (hence the current district focus) and for the evaluation.
The overall goals of the projects have been to increase and extend the levels of literacy and numeracy in Andhra Pradesh, and the immediate purpose is to improve access especially to disadvantaged groups to quality primary education services (formal and non-formal) in five districts. During the original Andhra Pradesh Primary Education Project (APPEP), a rather classical approach to evaluation was adopted based on large-scale surveys of outcomes measured by educational attainment tests.
There had been proposals to introduce more process and 'qualitative' types of measure (Rao 1997). Some of those suggested were, for example:
Delivery of Inputs
· Provision of APPEP initial in-service trainingEffectiveness of Inputs
· Numbers of visits made by Mandal Education officer
· Support of Colleagues as reported by teachers.
· Reaction to in-service trainingOutcomes of Impact
· Percentage of teachers participating in different activities of Teacher Centre
· Percentage of teachers regularly conducting group work
· Reaction of teachers to numbers of teacher centre meetings
· Pedagogical Group Work and Questioning and Pupil involvement
· Numbers of visits of parents to schoolsThe APPEP evaluation ran into difficulties of sustaining local capacity in the absence of an institutional structure. As a result, there was no formative evaluation (of the kind described above) and the feedback from the summative evaluations was slow; and the impacts were studied only at the school level, ignoring both the individual and community level. Basically, the problem was that, whilst all sorts of interesting data were being produced from the study, these were only useful as performance indicators in a top-down mode: what was and is required were indicators which would be immediately useful for project management - with the twist that the project management was itself (as far as was possible) participatory.
·Reported change in children's behaviours
·Children kept away from school
·Pupil enjoyment of school (pupil response to APPEP)
·Decrease in absenteeism
·Enrolment
·Attendance
·Routine test scores
·'Assessment'
The problem, therefore for the current (APDPEP) project, was to design a system of performance indicators, or mechanisms for collecting data with which to construct trial performance indicators, which would reflect this participatory approach to project management; and which would help build an informed network of community 'experts'. In this situation, the usual distinction between monitoring (a continuous management activity providing regular feedback to those hierarchically responsible for implementing the activity) and evaluation (an external means of assessing programme results and the appropriateness of the design in achieving hierarchically specified objectives) is unclear. Communities are continuously assessing process and outcome and, where problems are not due to absolute lack of resources, it is the communities that are best placed to examine those problems and identify solutions.
These considerations led to a three-stage/phase evaluation design: a school and pupil survey; a suite of qualitative studies; and a set of Indicators of Implementation.
School and pupil surveys, repeated over the lifetime of the project, were to measure the cumulative impact of the project against the principal project objectives and planned outputs. These would establish what the effect of the project has been and which children from different communities and socio-economic groups have benefited. The results, of the survey would portray the statistical linkages between enrolment, retention, parental literacy, economic status, drop-out and learning achievement.
In order to understand the processes, it would then be important to carry out qualitative studies, to provide insight into the patterns of success and failure uncovered by qualitative surveys. The combination provides project mangers at various levels with an understanding of the impact of the project. (See Figure 4).
In addition to complement the findings from the quantitative surveys, a variety of other kinds of case studies were proposed.
· one-off case studies of a 'good' school in different districts or the constraints experienced by particular schools in retaining girls;The qualitative case studies serve to complement the others in two ways. First, while the indicators of implementation provide rapid quantitative feedback, the case studies provide qualitative feedback speaking directly to teachers and community members through vivid and accessible accounts of strategies and practices in different classroom settings. Second, the case studies complement and extend the survey analyses by providing insight into, and explanation of particular patterns of progress (among a purposive sample of pupils, schools or local support agencies).· linked and/or longitudinal studies of change and development among schools and development among schools and Village Education Committees (VECs).
Figure 4: Quantitative and Qualitative Studies: Project Planning Process
An attempt was made to analyse the project concerns with planning and implementation in terms of five broad areas for action and to ask, in each case, three further questions. First, what processes would need to be set in place to ensure that this priority is reached? Secondly, what process or quality indicators might be quickly and easily collected which might suggest that progress towards the priorities was being made? And third, by what methods, with what frequency and by which individuals and groups, might the relevant information be collected?
The main priorities were identified as follows:
· the extent to which capacity building for programme implementation had started and the stage that has been reached;Indicators of Effective Project Management· the extent to which steps had been taken to help the local community participate in the affairs of the local school;
· the efforts made to enhance girls' enrolment and that of disadvantaged groups;
· the provision catering for the diversity of children's learning needs; and
· the steps taken to provide effective external support for teachers to enable them to perform more effectively.
The kinds of data required to assess project management included the following:
· nature of participation at different levelsThese data were then used to construct the following indicators:
· staffing of institutions
· physical infrastructure and any proposed improvements
· planning documents, site and supervision reports
· use made of non-personal resource inputs
· the extent to which participation is seen as usefulIndicators of Institutional Development Indicators of linkages at each institutional level included:
· shortfalls of staffing compared to establishment, by programme functions
· levels of maintenance of non-personnel resources
· quality of plans
· the areas of linkage (e.g. at the level of the State Centre for Educational Research and Training level, including training of Master Trainers, evaluations and research studies, production of materials); andThree aspects of institutions were evaluated: training, materials development and ongoing professional support.· the extent and effectiveness of the linkage process.
Training
Data were collected on the number of training courses and clients. This included subsets such as the training of Non-Formal Education/Alternative Education instructors, and in some areas, the training of Early Childhood Care and Education (ECCE) teachers; the timing of training (e.g. state training programmes intended for cascade might be initiated at times when training lower down the levels will occur at inappropriate times in the year); and processes of training.
The methods by which such data can be captured include survey and document analysis to pick up information on the number of modules offered, attendance numbers and timings of courses. The key indicators would be adequacy, organisation and relevance of the training process, for example, coherent sequencing of the training process (i.e. that the production of the required materials is in place before the training modules are implemented, etc.)
Materials Development
Basic contextual data include: the number of modules developed; the process of module development; and the availability and use of modules.
Methods for collecting this data include document analysis, use of focus groups, etc., discussions with recipients of training, participant observation, and structured and semi-structured interview techniques.
Ongoing Professional Support
Basic background data included: the frequency, number and purpose of visits to the school; then number and kind of follow-up activities; and the types of ongoing dialogue with teachers.
Key indicators were based on whether there is two-way communication or whether directives and training are delivered and no feedback is received; or whether needs and concerns of clients (generally teachers) were heard and responded to by the institution concerned.
A suitable timeframe for the simultaneous conduct of the evaluations involved collecting data, analyse and report back on the first component of the evaluation by the end of Year 2 of the project. This provided the appropriate stakeholders with some early information about the efficient implementation of training at a stage where corrective, formative and innovative interventions would be made. Capacity building and empowering of lower levels would be a guiding principle for data analysis. A further round of data collection and analysis will be made as a follow-up to subsequent interventions or ongoing implementation, sometime in the middle of the project. The exact decisions about when to initiate the follow-up study would be a state-wide decision. A final review would be made at the end of the seven year life of the project, with a particular emphasis, perhaps, on examining the sustainability of the institutions' effectiveness and quality.
Indicators of Community Participation
It was seen as important to find a way of collecting data on the part played by the community in the collection of data about enrolment and repetition, for example, through child-to-child monitoring, door-stepping, adopting of specific families/groups by the VEC - as an indicator of how much involvement there is at a real level from the VEC and other community members. The quality of community involvement in education, however, also requires indicators that register the satisfaction level of teachers and parents with the functioning of the VEC.
On an institutional level the setting up and functioning of VECs, the records of meetings, the incidence of discussions, the occurrence and resolution of critical incidents, have all been measured and taken as indicators of community involvement.
An indicator of growing co-operation and mutual support, for example, was the number of times that a teacher felt able to initiate questions or discussion with the VEC. Finally, a quality component was incorporated in the indicator itself: e.g. could members of the VEC discuss educational issues showing some understanding of the project aims in classroom processes?
Indicators of Access, Enrolment and Repetition
The collection of data through the school and pupil survey to supplement the initial baseline survey and Project (PMIS) and EMIS data gave an aggregated source of information at the level of numbers of children from the village who are school-going children, the numbers of marginalised group children attending/not attending school and the number of drop-outs in a year. More detailed data needed to be collected from the population, and for this, there were some village-based exercises such as censuses and registers. However, households from which students come could also be the basis of a sample of households who send at least one child of school age (6-14) to school. Indeed, it is almost a PPS (probability proportional to size) random sample of households who send at least one child to school, but not quite because a household with, say 5 children may only be sending three of them to school. The correct weighting for the number of children in that age group whom they actually send to school, however, can easily be calculated from data collected at the interview stage.
It will be important to study a sub-sample of this kind for a number of reasons linked to the equity, enrolment and community participation objectives:
· the reasons for sending some or all children to school;The school and pupil survey will yield quantitative, factual data which will be able to be used in investigations of community participation. The triangulation of figures through interview, small studies, Participatory Community Appraisal (PCA) and a number of small case studies will add detail and reveal new and interesting questions, throw light on wider issues and corroborate data collected through the baseline survey and PMIS, EMIS. It will be possible to cross-reference across similar or different communities with similar project inputs, e.g. new school, trained teachers, and to note patterns of similarity or difference. This will provide the basis for further qualitative investigation.
· the encouragement given to, or motivation of children to go to school; and
· involvement in school (PTA, homework, etc.)
Indicators of Teacher Training
From the point of view of the project, the quality of training can be thought of as evidenced in the changes that occur in teaching and teachers as a result of the training input. It is assumed that pedagogic and attitudinal changes in teachers can lead to improvements in children's learning, classroom interactions, and perhaps in terms of teacher attendance and retention also.
The in-service training of teachers can be divided into three sequential stages: preparation of materials, planning and implementing the programme, and the effectiveness of the programme in practice.
The Preparation of Materials Prior to Planning
Indicators of stakeholder participation in the preparation of materials proposed are:
· whether teachers have contributed towards the planning and preparation of materials;Organisation of the Training Programme· whether teachers have provided examples of good practice explicitly related to the training; and
· whether there have been trial runs of the training materials before planning, in order to smooth out any problems with the materials.
Assuming that basic data about the programme (for how many, how long, where it takes place, methods of delivery, content) has been collected, the kinds of indicators of effective functioning would be:
· whether actual training matches the plan and how the training programme is assessed;The Effectiveness of the Training Programme in Practice· the extent of active involvement of participants including the existence of follow up sessions and their feedback; and
· the sustainability of the programme.
The final outcome of training is its effect on classroom methodologies and children's learning. This will be considered in the sections on school processes and learning achievement. Specific training indicators relate to:
· whether teachers have changed their pedagogy or whether they mimic the model lesson when they are being observed and in all other lessons revert to didactic, front-of-class instruction;· efficiency in terms of cost and the use of existing structures and trainers; and
· is there a significant transmission loss in the cascade model and does this vary between teachers and trainers?
School-Classroom Processes
Key evaluation questions are raised in this area and these questions may, themselves, inform the development of indicators of key classroom processes and understandings. Such questions include:
· What are the factors that make for differences between schools?Answers to the first question would be desirable (world-wide!), and it is important to establish first what different stakeholders perceive to be a 'good' school. Only the last two issues are strictly relevant here, and the first has already been considered in another section (on the use of appropriate building/construction technologies).· What is perceived as a 'good school' by the community?
· How do teachers evaluate a 'good school' and what do teachers see as factors in school improvement?
· Do physical facilities have an important effect on school improvement?
· How are the effects of training shown in practice in the classroom, i.e. what does the teacher do that is different?
Hypothesised indicators of a link between training and the classroom include:
· actions indicative of activity-based and participatory learning;The Evaluation of Learning Achievement and Teaching-Learning Materials· use of resources and materials, especially those in local environment;
· lessons conducted in a gender sensitive way; and
· effective multigrade teaching - e.g. evidence of differentiated learning.
(i) Non-Cognitive Learning Achievements
One of the biggest challenges under APDPEP is the broadening of the concept of what constitutes learning achievement. Children achieve many things in school; in a good school many of these achievements are in the psycho-motor or affective domain. Already Indian education places greater emphasis on citizenship, social awareness and parity within a secular state. How these aspects of children's learning can be integrated into learning improvement and progress measures, thus giving them validity and importance in the eyes of parents and the community will be an ongoing concern throughout the project.
The 'ground work' for these studies is not yet in place. A sweep of primary school practices in the non-cognitive domain is required. At the beginning of the textbook development component of APPEP, teachers were asked to send from their Teachers' Centres (TCs) examples of their work in Class 1. The response was overwhelming and substantially informed the work on the Class 1 textbook. A similar request for information about non-cognitive activities: craft work, work-related studies, e.g. agriculture, weaving, drawing, gardening, music, dancing, cultural studies and contingent activities such as scouts and bulbuls, might reveal a wide range of interesting activities.
Short studies using photographs, video and participatory discussion would suggest what is going on in these areas. It is unlikely that a measure of non-cognitive achievement could be devised, but teacher assessment or assessment by the community and reference to them in the teaching/learning materials would at least illustrated that there had been some impact of these activities.
(ii) The Development of Indicators for Learning Improvement and Progress
Indicators of progress at Class 2 and Class 5 are to measured by tests of literacy and numeracy. These measures will not be without difficulty. For example, a true measure of literacy must include primary children's ability in writing and oral language.
The development of assessment procedures for writing have been incorporated as part of training developments to include teachers learning about the processes of writing, and children being given the opportunity to develop writing so that it can be used to effectively express their own ideas and understandings. Practise in writing in the classroom, moderation of writing across schools at the TC and children learning to assess, edit and improve their own writing are an integral part of this process which will need to be supported by practical, experiential training for the teachers. Oral language, like writing, needs to be assessed on other criteria than 'correctness' and will be part of the same training package involving teachers and children in awareness of the importance of communication rather than correct copying and repetition.
Table 8: Project Specific Indicators for the Participation Objective in APDPEP
|
2. Making The Community Participate in the Affairs of the
School |
1. Involvement of the community in the planning
process |
- Evidence of education agenda as per record of meetings - Training of village core group in microplanning and school mapping process - Study involvement of women/SC/ST in planning exercise - Analysing the constitution of the VEC in social terms. - Presence of women in VEC |
1. Analysis of 5% statistical sample of schools through trained DIET Evaluators to seek evidence of participation. 2. Participant observations by NGO representative followed by report through the Block group to the DPO. 3. BRC/CRC Co-ordinators to evaluate social composition of
core group involved in the planning process and also analyse the membership of
the VEC. |
|
|
2. Support of the community to the school |
- Evaluate financial support provided by community to the school in materials and labour - analyse donations received from community - time spent by parents in school during school activities - support extended to the school teacher |
1. BRC/CRC staff can evaluate on the basis of VEC records 2. Process observation by resource persons involved in training VEC members. There should be a standardised reporting format. 3. Record perception of school teacher regarding assistance
from community by interview method. It may be conducted by a DIET
faculty/BRC/CRC staff. |
|
|
3. Participation of the community in the enrolment of
children |
Participation of community annually in the preparation of the
Village Education Register along with the Teachers and the children of Class IV
and V |
1. Women's Self Help Group Leaders, Dwera volunteer to report on this activity to the Block Resources Group. 2. Women's Development Office in DPO to conduct some field studies in sampled villages. 3. This activity should be evaluated by CRC at their level and report on good and bad cases sent to BRC. BRC should share these findings with DPO. Some villages not doing well should be subject of an intensive study by external agency. Study to suggest remedial measure. 4. These studies to concentrate at the time of enrolment but there must also be a review every quarter at the CRC level. 5. Effective enrolment to be calculated by subtracting the
number of children not attending school on 50% working days, from those shown as
enrolled as per school register. School headmaster should make comparison with
village education register to find out actual number of non enrolled
children |
|
|
4. Participation of the community in the activities of the
school |
- Number of functions held in school when parents were invited - Number of parents who attended these functions - Assistance provided in organising school sports, cultural
meet, Bel Mela |
1. School headmaster to submit report in format every six months to CRC Head. 2. CRC to visit school on function days and submit report to BRC. 3. Participant observation by resource persons in teachers' training for non cognitive areas. Their reports should be sent to DIETS. 4. DIET faculty to make comparative study of these
reports. |
|
|
5. Formation of representative VEC |
- Analyse process of VEC formation - Number of the core group members who took interest in the initial planning phase who have become members - Number of women, SC, ST represented. |
1. BRC level resource persons involved in VEC training should
be used as process observers. They should report in design format to DIET. DIET
staff to undertake analysis of these reports and send small report every 3
months to the DPO in tabular form. |
|
|
6. Involvement of the school community in the school
construction programme. |
- Number of active members visiting school site during construction and recording their names in the site book. - Level of maintenance of accounts and its sharing in
meetings. |
1. Junior Engineer who visits site must check site book and report to Block Resource Group/DPO 2. School head master to report to CRC regarding school construction. 3. Retired teacher to make site visit and report to DPO. 4. Engineer belonging to another department to make site
observation (he is external to activity) |
This section has shown how, at a micro, evaluative level, it is possible to elaborate very large numbers of performance indicators. In principle, these could be modified by local communities to reflect their own concerns. But, there is clearly a danger that they will be taken far too seriously by the level immediately above the community, thereby distorting the local community's energy into meeting the performance indicators rather than achieving their own targets which are perhaps not easily expressed in such definitive terms. It might be better to experiment with the development of a pilot set of indicators covering only one aspect of community participation before extending to cover the wide range of issues potentially involved.
1 Revised and updated version of this section has been published in DFID India (1998) Evaluation in Primary Education - a Handbook for getting Started, New Delhi, and in McKay and Treffgarne (1999, eds.), Assessing Impact, London, DFID. The focus here, however, is on the development of the design rather than on any specific performance indicators.
2.4.1. Framework: Levels and Purposes of Use of Performance Indicators
2.4.2. Current Educational Initiatives
2.4.3. Indicator Development and Use
2.4.4 Concluding Remarks
This case study is intended to provide a snapshot of some of the developments taking place in the creation of education performance indicators in South Africa today. It is based on five days of interviews in Johannesburg, Pretoria and Durban in the week of the 7th April 1997.
If the only purpose of this case study had been to report on the use of education performance indicators in South Africa today, there would have been little to report, as the visit in April 1.997 was too early. Thus, some of those interviewed reported that they were busy either creating the framework for data collection or in the data collection itself, in the absence of fully-specified indicators, let alone their use. The urgency of establishing a national data base of the country's schools has taken precedence over the development of indicators. And plans are being put into place for the development of the management capacity of appropriately using such indicators as are created in the longer term. In some ways this is perverse, as the realm of performance indicators is defined by the data available.
Many of the discussions held related to a theme emphasised in the first Kenyan case study, namely the process of deciding what information to collect. The political context in which such performance indicator schemes are developed was a focus of discussion, echoing a further theme raised in the first case study. What is significant is the conflation of purposes envisaged in performance indicator development in the discussions held, particularly as those with least political clout can easily have their information needs overshadowed. Thus, one of the focal points of this study will be to unpack the different uses envisaged for performance indicators at different levels of the education system and the data requirements for their construction, given the perspectives represented.
In what follows, first a matrix of different power constellations surrounding the different uses of performance indicators is portrayed as the different levels of actors are considered in turn. This rough matrix is not intended to be a definitive representation of South African educational networks but it is intended to serve as a backdrop to some of the major issues concerning performance indicators that were raised in discussion. This forms the second part of this case study: how the roles of the different players are coloured by the influence of several educational initiatives already launched as well as legislation enacted. The third part of the case study discusses some of the indicators made possible by the current data collection exercises as well as those needing to be carried out to serve wider purposes than those already envisaged.
Table 9 very roughly sketches the main purposes and/or uses of performance indicators by different actors at different levels across the education system in South Africa today. The roughness of this portrayal should be emphasised, as well as the fact that it is a current picture; no doubt, many nuances at each level will be missed; and no doubt, over time, many of the boxes left blank will be ticked, as further responsibilities are undertaken at different levels. Nonetheless, the matrix does represent the slightly blurred snapshot taken in April 1997, albeit with somewhat artificial divisions of responsibility.12 For instance, of course the national Department of Education is involved in planning. The provincialisation of responsibility, however, sets out a division of labour that accords the national Department the responsibility for monitoring and evaluating the provision of education, whereas the provincial Ministries are accorded the management and implementation of the programmes according to norms and standards developed at national level. Indeed, a recurrent theme raised during interviews was the "unfairness" of the provincial governments being held accountable for attaining standards, the prerequisites of which are not similarly mandated by the national government.
Thus, working from the top row down, according to the National Education Policy Act, 1996, the Minister of Education is responsible for the monitoring and evaluation of "the standards of education provision, delivery and performance...with the object of assessing progress in complying with the provisions of the Constitution and with national education policy." The directive principles of national education policy are set out in Section 4 of the Act and, among many other things, include:
· achieving equitable education opportunities;As noted during discussions, this broad national responsibility for monitoring and evaluating the norms and standards of education was challenged in the courts. The national Department won, setting the momentum for carrying out this role. Following this first legislation, the South African Schools Act, 1996 provides for "a uniform system for the organisation, governance and funding of schools". As will be detailed below, a new Annual Survey for Schools was carried out on the 22nd April 1997, thus providing the baseline for monitoring and evaluating national education policy. The norms and standards for funding schools in line with the South African Schools Act. 1996 are still under discussion by the Heads of Education Departments Committee (HEDCOM).· achieving the redress of past inequality in education provision;
· enhancing the quality of education;
· ensuring broad public participation in the development of education policy;
· achieving the cost-effective use of education resources; and
· achieving close co-operation between the national and provincial governments, including the development of management capacity. (National Education Policy Act, 1996: 8)
Table 9: Matrix of Actors and Purposes of Performance Indicators in Education in South Africa
|
Actors/Purposes |
Monitoring |
Formative Evaluation |
Planning |
Management |
Accountability |
|
National Department of Education |
X |
|
|
|
X |
|
Provincial Ministries of Education |
X |
X |
X |
X |
X |
|
NGOs, Research Organisations |
|
X |
|
|
|
|
Schools, Heads, Teachers and Governing Bodies |
X |
X |
|
X |
X |
|
Parents, Students, Communities |
|
|
|
|
X |
Section 8 of the National Education Policy Act, 1996 makes clear that the nine provincial Ministries of Education and Culture are accountable to the national Department of Education for the provision, delivery and performance of educational standards. It is their responsibility to remedy the situation if they do not comply with the Constitution or national policy. Thus, the provincial ministries must be engaged in monitoring, formative evaluation, planning and the management of education, falling short of the summative evaluation function left to the national department except with respect to their own constituencies.
It is worth mentioning at this point the 'sea-change' that was expressed as being necessary to begin to use performance indicators as tools of planning and management, to take two of the four functions designated at this level. With the exception of the matriculation pass rates in the past, indicators had not been published, and only direct input controls had been used. It is argued, there had been no 'need' for indicators to see what was happening in the system. The amount of education and training necessary to modernise educational management was not underestimated by anyone but, as with the development of performance indicators, where data collection has taken precedence, so is the placement and training of education officers required before a 'climate' of indicator use can be created.
In the next row, which is NGOs and Research Organisations, a variety of institutions are included, from education policy units, to university departments, to non-governmental organisations involved either in school improvement activities or school effectiveness research. A lot of activity in this area is donor-funded, whether from within South Africa, for instance, through the National Business Initiative or the Independent Development Trust, or from outside, through DFID, CIDA, USAID or the many other donor agencies involved in educational aid programmes.
Formative evaluation is identified as comprising the main use of performance indicators for this level of activity. Of course, if one is talking about specific projects, all of the different purposes will be carried out. The focus of analysis here is, however, with the interplay not within the project, but between any projects and national or provincial educational development plans. Thus, the key linkage is what can be fed back, in particular, to improve the quality of educational programmes. Monitoring to ensure equitable distribution of resources is relatively simple. Evaluating the use to which different types and levels of resource are put brings us into the realm of school effectiveness and different notions of school quality, as it is understood and evaluated in different contexts.
The next category of 'actors' is at the level of the school. Putting heads, teachers, and governing bodies together in this category, however, does not necessarily mean that there is a uniformity of perspectives, despite the hope that all are cooperating in achieving the educational interests of the school. All but planning has been included in the use of performance indicators at the school level. This is because, at present, school-based management is not the reality that it might become. Thus, whilst everyday management is carried out, there is not widespread school development planning encompassing at the school level the sort of prioritisation of investments that are having to be done at the provincial or district levels. As per Section 20 of the South African Schools Act. 1996 governing bodies are entrusted with the provision of quality education and are ultimately accountable both to the parents, students and the communities they serve, as well as being accountable to the provincial ministry and the national department. Thus, there is the need to use information (namely, performance indicators) for this purpose.
Finally, whilst parents, students and community members may sit on the governing bodies of schools and thus play wider roles in the school's development, their use of performance indicators outside such alternative roles, is judging the quality of the school. Thus, accountability is highlighted, whether from the perspective of the student's own evaluation of his/her performance or the parents' or the community's evaluation of the school's performance as a whole.
This matrix represents a range of very different perspectives and very different purposes of the use of performance indicators in education. Not all perspectives were canvassed in the limited time available in South Africa for this case study, nor were all purposes of performance indicators addressed. Nor is this matrix immutable. On the contrary, it is more than likely to change, particularly as data are collected, performance indicators created, and the management, planning and evaluation capacity developed across these levels in the many uses of performance indicators. Against this backdrop, the next section describes some of the actors and their functions in the matrix as defined by several new initiatives in education in South Africa today.
The national Department of Education has been preoccupied with the establishment of frameworks and mechanisms for policy change. Reference has already been made to two pieces of educational legislation which have set out the framework for national education policy and the governance and funding of schools. In addition, other significant initiatives have included the establishment of a National Qualifications Framework; a new, national curriculum, Curriculum 2005 (and related to these two initiatives, a South African Qualifications Authority); and the beginnings of a monitoring and evaluation system based on a new Annual Survey of Schools which will feed an educational management information system. Other initiatives which are still in progress, include the formation of an educational management development institute, a task set the interim committee established by the Minister, following the report of the Task Team on Education Management Development and subsequent legislation.
While indicator development as such has not featured prominently, the provision of a monitoring and evaluation system, and specifically an educational management information system (EMIS) has been a priority concern. The mandate for establishing an EMIS was given to the national Department of Education in the National Education Policy Act, 1996. A national EMIS steering committee was formed in June 1995 which presented a proposal to government in September 1996, following study tours of the management information systems in 20 countries and the deliberations of five task teams (Republic of South Africa, Department of Education, National EMIS Steering Committee (1996a; 1996b; 1996c). The guidelines for the development of the new EMIS laid down the importance of consensus between the provincial and national departments of education, its facilitating role for these two levels of educational administration, that the system should be capable of providing data for policy making, planning, management and monitoring of the education system, that it should be demand driven, and that it should facilitate public access to education statistics and information (Republic of South Africa, Department of Education, National EMIS Steering Committee 1996b: 2).
Parallel to the development of the EMIS, and in particular, the definition of a core data set for collection in the annual survey, another special survey was conducted of all schools in the country, the School Register of Needs Survey, designed to locate and register the physical resources and condition of all schools. The necessity of conducting this survey was the discovery of many 'ghost' schools and 'ghost' teachers, the inability physically to locate many schools and the uncertainty of their provisioning. Computerised maps of the data collected through a geographical information system (GIS) have been prepared, creating a provincial level browsing programme enabling the viewer to choose which data s/he wishes to explore at the provincial or sub-provincial level.
Curriculum 2005 introduced in April 1997 builds on the National Qualifications Framework (NQF) established in October 1995 (South African Qualifications Act, 1995) whose objectives are to "create an integrated national framework for learning achievements", facilitating "access to, and mobility and progression within education, training and career paths." The new qualifications' framework has broken the previous, segmented pathways to exclusive, rather than inclusive qualifications.
Specific, context-specific learning outcomes, will serve as the assessed units, complemented by "critical, cross-field outcomes" representing much broader, educational goals. A continuous, formative assessment model will be applied to enable learners to progress at their own pace, and not necessarily through conventional, age-graded classes. Criterion-reference assessment, however, in line with the outcomes-based approach, will "underpin all classroom assessment, i.e measuring individual performance against the defined NQF standards." (Republic of South Africa, Department of Education 1997b: 37). The South African Qualifications Authority (SAQA), appointed in May 1996 is responsible for formulating guidelines for accreditation, setting standards and monitoring achievement. External assessment will be done at the end of each level of the compulsory nine years of education, thus, at grade 3, grade 6, and grade 9. Only the final assessment will be used for selection purposes.
A Task Team on Education Management Development was appointed by the Minister of Education in February 1996. Its responsibility was to make proposals for improving education management capacity in South Africa, and more specifically for establishing a national institute for education management development. The Task Team produced an audit of education management needs and provision in each of the nine provinces, as well as its formal report published in December 1996, Changing Management to Manage Change in Education. Its recommendations build upon school-based management as a resourced and supported goal for bringing about quality, effectiveness and efficiency in the education sector, and are reflected in the guidelines for constituting school governing bodies laid out in the South African Schools Act. 1996. A task group has been set up to see to the establishment of a national institute for education management development.
Over this interim period in which frameworks, guidelines and responsible authorities have been defined for the educational reform, many non-governmental or research organisations have filled the gap in monitoring and evaluation, producing a variety of reports and studies examining schools, particularly as they are changing as a result of different interventions. Together with an examination of the development and potential use of indicators for the purposes identified in the matrix in Table 9, the third section of this case study looks at the role that this wider network of organisations can play and the design of their studies to fulfil some of these purposes.
Background Issues
It would be quite incorrect to say that education performance indicators had had no life in post-apartheid South Africa to date. Indeed, one of the most widely reported (to me) uses of a performance indicator was in the experience in the Western Cape of applying the pupil-teacher ratio (PTR) to equalise resource distribution across the provinces. The story tells as much as one needs to know about the importance of not using performance indicators as if they are technical, apolitical constructs. As the story was told, in 1994 the national Department of Education decided to equalise expenditure between the provinces and worked out budget cuts incrementally over a five year period, based on the pupil-teacher ratio. The Western Cape, having a very favourable PTR - about half as many pupils per teacher as the other provinces - managed to squeeze additional funds at cabinet level to get more for education and thus delay any teacher retrenchment in the first two years. In 1996, however, the province was forced to implement national policy, and retrenched several thousand teachers, only to be. subjected to the political backlash of such an unlikely strategy for equalising teacher deployment. If only people moved as easily as the numbers in this exercise!
Four goals underlie the broadest use of performance indicators in South Africa today: equity, redress, access and quality. They are interrelated, as have to be the performance indicators that serve to monitor them. For instance, access is a starting point of the NQF, that there be multiple pathways toward multiple entry qualifications. If access, however, is only to poor quality institutions, then the significance of access is diminished. Ironically, in the case of sub-Saharan Africa, the lack of attention to quality has fed enrolment declines, reinforcing the view of the necessary expansion on both fronts.
South Africa is attempting a radical educational reform, compared to many of its neighbours. It is worth portraying the challenges involved in accomplishing these reforms.
When explaining the purpose of this case study during interviews, most respondents were quick to explain that there was no tradition of use of performance indicators. Indeed, what was absent was a culture of information use, full stop! There were two very different ideas underlying such statements. One view was that education had not been planned, in the sense of prioritising according to needs, so this would be 'news' to those on-the-job and a new area for those recruited into some of these new posts. Another was to explain how sophisticated South Africans had become during the apartheid era either of camouflaging themselves so that information reporting necessarily would be unreliable or that its danger had made them indisposed - not out of lack of experience, but rather out of mistrust - toward the use of information. There is therefore a challenge in generating appropriate data use at all levels of the system.
A related theme that emerged in discussions is also familiar in most countries: the divide between those with a background in information technology and those 'planners' and other administrators whose interests in the products, say, of EMIS, emerge from the questions asked of the system, however the data are generated; answers to these questions would not necessarily have been produced in the past with computers. Thus, there is often a divide between two, rather different traditions which requires some bridging to ensure that it is the planning questions, rather than the technology used that drives EMIS development and the creation of performance indicators. Nor is this a "one-off' situation, to be addressed only when discussions are taking place surrounding the selection of a core data set. The need to make and continually reinforce this bridge will remain as long as there are administrators trained without IT skills, and whose knowledge of the educational system is valued.
Finally, given the structures that have been created by the new legislation and the division of responsibilities, there needs to be a high level of co-operation and trust for the challenges of the educational reform to be realised. First, as noted above, the structures themselves create an imbalance in power and responsibilities: the national Department sets the norms and standards to be achieved, but cannot mandate the means of bringing these about. Second, the continual development of such co-operation and trust is dependent on relatively democratic feedback within the consultative networks that have been utilised to create this vision of reform, but which are now set with different responsibilities of bringing it into existence. No one interviewed denied that consultation has continued to play an important role in policy development in post-apartheid South Africa, but several pointed to the lack of accountability of representation from institutions to their own constituencies.
Indicators
School Register of Needs Survey
In addition to identifying the school, not only by name, and address but physical location, so that it can be positioned on a map, the following categories of information are collected, those relating to the students and teaching and non-teaching staff, the same as those collected in the Annual Survey for Schools.
|
· school type and level and type of funding and owner of premisesPhysical Information about school · administration areas specified by type and size |
Two forms of output of summary statistics based on these data points were seen: (i) in a booklet produced for the first provincial workshops; and (ii) the provincial 'browser'. In the former most statistics were calculated by circuit, so one had bar charts of the number of schools, teachers, pupils, pupil-teacher ratio, pupils per classroom, instruction areas, pupils per toilet, staff per toilet, primary to secondary pupil ratio, shelters, instructional areas for special subjects, estimated shortfall of student, teachers' and administrators' furniture and equipment.
Further provincial level statistics were then calculated, illustrated in the form of pie and bar charts: schools by level, owner (by type) of premises, availability of telecommunication, water, water source by type, provision of fencing, power and energy supply, schools according to condition, funding, other facilities being used as well as other uses of school facilities, adequacy of provision of furniture, equipment and materials, and other resources.
It is clear that these statistics are essential for some of the initial, physical planning tasks at provincial level, particularly as much of this information was simply unknown. The indicators produced at the circuit level can help target resourcing by need where inadequate provision of basic teaching staff, facilities and materials is found. There is nothing detailed on the levels of qualifications of teachers, which is collected as part of the Annual Survey for Schools, but the Register will play an important role in providing a baseline for monitoring equity of resourcing and quality of physical inputs, outside more sophisticated notions of staff skills and training levels. The primary to secondary school pupil ratio will serve as an important, initial indicator of secondary school access, and as was explained to me for the Kwazulu Natal province, that was one of four indicators being used in the first instance, the others being learners per classroom; learners per educator; and educators per classroom.
Regarding the second 'product' of the School Register of Needs Survey, the 'browser', some of the maps produced to date for some of the provinces were examined.13 These, like the summary statistical tables, were to be fed into the two provincial level workshops planned for each province. To date, what had been produced were maps of some of the summary statistics by circuit, e.g. the pupil-teacher ratio or the provision of particular resources.
What was interesting were some of the different reactions to the use of these data. For instance, one person at the district level for Gauteng, made the point that obtaining the raw data was much more useful than receiving the summary statistics that had been produced. This was because what was needed was to get their own people used to manipulating the data and creating indicators, so that they had both the familiarity with the numbers and an understanding of the meaning of the indicators. This chimed in with some of the verbal reports of the provincial workshops: that it was difficult to tease questions out of the participants, what they thought would generate the next steps forward in the computer mapping. What this suggested was a link to the point made above about different ways of 'knowing' an educational system and the bridge that needs to be made between those with an IT background, and those, for whom even planning is alien, no less the use of tables or maps of indicators. With the caveat that it may have been too early to judge, illustrative of this gap was the fact that no maps had been produced by the time of this investigation highlighting degrees of 'neediness' based on the variety of indicators made possible in the data gathering. This would seem an obvious starting point for 'planning' questions. Maps are wonderful tools, particularly for overcoming the reluctance of many to engage in discussions concerning statistics. If those needing to use the maps are not able to query the data and extract information that is meaningful to them in their positions of responsibility, however, the attraction of using such high technology is diminished because of the disempowerment it can bring about. This underlines the importance of developing the capacities of those with either IT or education backgrounds so that they will be able to use such new systems to good effect.
National EMIS: Annual Survey for Schools
In the proposal for a national EMIS, it is noted that: "A system of indicators will need to be developed which annually tracks the progress of the education system." (Republic of South Africa, Department of Education, National EMIS Steering Committee 1996b: 13) Specific mention is made of the need to generate enrolment ratios and gender participation, both in terms of access and outcomes. Cohort flows to establish the internal efficiency of the system are also mentioned, and 'output' measures to ascertain quality improvement. Finally, it is suggested that "target groups will need to be identified to establish if the intended equity in delivery has been achieved." (Republic of South Africa, Department of Education, National EMIS Steering Committee 1996b: 13). As already noted, the mandate for monitoring and evaluation given to the national Department of Education in the National Education Policy Act, 1996 is broad. This section will discuss the state of progress toward carrying out this mandate.
In the Annual Survey for Schools, more information is collected than is the norm for many other countries in their educational censuses. Specifically highlighted are the amount of income and expenditure data required from respondents as well as information on the composition and functions of the newly constituted governing bodies. Included in the categories of information on which data are to be collected are:
|
· Identification codes (including linkage with PERSAL (personnel information system) and examination centres2. Learners and Educators ·Learners by grade, race, sex, age; sex by grade; grade by home language |
Teachers (linked to PERSAL) by sex, age, race, language, level of post and category, appt., experience, paid by, qualification category and type, subject specialisation, hours taught including remedial, subjects taught
This is an impressive list, and if the actual data collection can go as smoothly -and apparently reliably - as the pilot survey, then much of the mandate for monitoring and some for evaluation will be capable of being fulfilled. Linking the annual survey data with the recent population census clearly will make it possible to detail access. Similarly, the information gathered concerning learners at each school in the system will facilitate the construction of cohort flows. Although not without a battle, the racial categories were reintroduced in the new instrument, the arguments for facilitating the monitoring of redress and equity, clearly winning out to those concerned about not wanting to reinforce existing prejudices. To the racial categories have been added home language, so that it will be possible to track provision for different parts of the school population. Cross-tabulations of, say, achievement data, if these are truly linked to the schools' reports, and multilingualism, or particular home language dominance or percentage failing or repeating, will serve as a launchpad to further diagnosis of the system.
Some interviews emphasised that capacity building in the use of information at present is for redistribution, not for quality, so the development of indicators, in the first instance, will be relatively more straightforward (see below). If redistribution is meant to be on the basis of equity and redress, rather than a straight pupil-teacher ratio, as was used in the Western Cape, two alternative, extremely potent indicators would comprise some categorisation of educators' qualifications and/or educators' costs (roughly = salaries) by school; or government-funded vs. total pupil-teacher ratio, identifying those schools which hire many additional staff through the fees charged. Further, if reliable income and expenditure data by school are obtained, there can be further monitoring on equity grounds.
Again, to the extent that the culture of learning is restored and the education system becomes more stabilised, indicators of failures or repeaters by school and by age and gender and language group and/or medium of instruction similarly, will become potent indicators for closer examination.
The inclusion of information on the governing bodies is an interesting means of gauging the 'democratic transformation' of the education system at the lowest level. Given that the goal is for there to be school-based management, it seems a very sensible area on which to collect data, in order to be in a position to target capacity building, as needed. The further informational requirements for parents and communities to become the ultimate judges of educational quality are, however, much greater than what is required to judge the abilities of the parents and communities themselves. Whether the governing body has developed a mission statement for the school or adopted a code of conduct for learners is something that can be verified, without too much obfuscation. Whether one can attribute to the school, rather than the pupils' own backgrounds, the quality of their academic achievement or other outcomes, however, is not as straightforward.
In the first instance, it is worth separating out different notions of quality. Quality can be and is often monitored on the basis of inputs, rather than processes or outputs. It should not be supposed that an annual educational census is capable, necessarily, of drawing out the causal links between these different factors. Yet, implicitly, our information systems are based on what are felt to be important constituent factors in monitoring quality (as well as equity and efficiency). If in the case at hand, the South African national Department of Education were only to concern itself with quality as inputs, redress would sound hollow. Comments on the development of some indicators proposed to be developed from the Annual Survey for Schools will be made in the context of recognising that it is important to monitor more than inputs bearing on 'quality'. Comments will also be coloured by our knowledge of a further constraint: the fact that our models of education are neither adequately addressed in annual census surveys, nor, one might add, in more sophisticated research designed to play out the causal links between inputs, processes and outputs.14 In Annex 2A to this chapter further proposals for the development of indicators based on interlinked data sets are discussed.
Overlaying all the above attempts at indicator creation is the knowledge that outcomes (and thus, quality) will be expressed very differently from the relatively simple matriculation passes, as different national assessments begin to be made at the two new lower levels, grade 3 and grade 6, and the use of continuous assessment at the school level, requires a very different understanding of 'outcomes' from what has been used to date.
The norms and standards for school finance are in the process of being formulated. The national Department is caught, however, much like a donor - in not being able to specify how much a provincial ministry should spend; instead, it is likely to be left with 'conditionalities', e.g. proportions of the budget to be spent on x and y, respectively. These conditionalities, like any indicators used for accountability, will be contested by the provincial ministries if the basis of their determination is in any way questionable.
One Window on DFID Education Project Evaluations
Specific project evaluations feed the formative evaluation role of implementing institutions. They also raise questions about macro vs. micro evaluations of quality. Discussions with the English Language Educational Trust (ELET) illuminated one aspect of the changing design of such evaluations. It was noted, for instance, that in the evaluation carried out of DFID's Primary English Teaching for Rural Areas project (PETRA), that inputs (or you could say, processes) are the observations, not the outputs in the sense of the students and their learning. One is observing teacher behaviour, so one is looking at the quality of learning only indirectly. Examples of the observations recorded will be familiar to many: recording the use of materials by learners and by teachers; the grouping of learners; the questions asked by learners and by teachers, etc.
Similarly, in a collaborative evaluation effort with the USAID Improving Educational Quality (IEQ) Project team, the main questions asked concerning the impact of ELET training at the classroom level were:
1. In what ways do teachers with different levels of training teach differently?Learner participation, interactions with the teacher and other learners, and use of materials, for instance, define the learner outcomes identified for observation. What results is a rich data source on the changed classroom experiences from both the teacher's and learner's perspectives, but missing is the more direct evaluation of learning outcomes.2. In what ways do learners in classrooms taught by teachers with different levels of training participate differently?
3. In what ways do the classroom learning environments of teachers with different levels of training differ?
4. What is the relationship of other variables such as education, teaching experience, age, and gender on teaching, learning, and the classroom learning environments?
Such monitoring and evaluation of change at the level of the school and/or classroom, while serving the formative evaluation needs of those designing in-service training programmes and materials, falls short of the needs of those focused on whether learning outcomes are thereby improved as a result of the enhanced classroom experiences brought about. This is quite characteristic of school improvement projects, falling short on the evaluation of student outcomes15 The draft logframe for a new DFID education project in the Eastern Cape (ECSIP), recognises this. Built on a baseline study of pupil-level literacy and numeracy, evaluation is made possible of enhanced student outcomes.
There are many other examples of evaluations on which one could draw to illustrate the different data and performance indicator needs at different levels and for different purposes, as well as what, in effect, are very different starting points, whether from a systemic, macro-level school effectiveness orientation, or from a more micro-level, or at least school-based, school improvement orientation. The provincial Ministers of Education are concerned with how best to allocate limited resources, given the challenge of meeting the inclusive goals of the new education system. The project manager's concern, or the school head's concern, is whether the project inputs, e.g. in service training, have resulted in changed classroom behaviour. Ultimately, they are concerned with school quality, particularly, if they are to be made accountable increasingly to performance indicators designed to evaluate the quality of education in terms of learner outcomes. For the time being, however, monitoring and evaluating the effectiveness of the processes or inputs has not had to run the full gamut to include learner outcomes.
In the conceptual framework portrayed in Chapter One the problems of achieving consensus in choosing indicators for different audiences and different purposes was raised. This snapshot of South Africa in early 1997 illustrates the challenge of addressing the diversity of purposes and perspectives in such indicator construction. It is worth pointing to a fundamental, philosophical divide that underlies some of these different perspectives. It is described clearly by Carrim and Shalem (1996: 2-3):
In general, the delimited research emphasis on uniformity and homogeneity across schools leads to generalised, macro formulations and technicist solutions that assume schools are rationally organised systems and that their experienced problems may be remedied predominantly by monetarist interventions.They go on to write:
While the quantitative-based model of efficiency can measure, compare and calculate test scores against the background of classroom and teachers ratios and other inputs; can prescribe organisational procedures for an efficient management, what it can not do, however, is to tap into the interests and perceptions of the students, parents and teachers - the main social actors of the educational process, (p. 18)The centre/s of policy making must appreciate and have knowledge of classroom realities and the classroom realities need national (and global) grounding. The danger that South Africa faces is not really as different from other countries as some would have us believe. Should the urgency of policy making take such precedence that the informational (no less resource) requirements of policy implementation become eclipsed, then the distance that has been created between the national Department of Education and the provincial ministries, rather than being bridged through trust and co-operation, increasingly will become arenas of power contestation. Thus, provincialisation runs the risk of undermining rather than enhancing stability. The challenge of identifying and appropriately using performance indicators in the new South Africa demands sensitivity to the different perceptions of stakeholders and policy makers at the different levels portrayed in Table 9, linking their distinct purposes of monitoring, formative evaluation, planning, management and accountability.
Further Proposals for the Development of Educational Performance Indicators in South Africa
In a paper commenting on the national EMIS proposal, Dr. Luis Crouch, a consultant working within the national Department of Education, has written about the need to link the examinations data base with the annual survey data:
It will be vital to being able to defuse all kinds of fuzzy debates about "quality" and it will also be vital to being able to identify schools or districts engaging in highly productive practices, and being able to generalise and reward those practices. (Crouch 1996: 10)He develops this idea further suggesting the interlinkage of socio-economic data from the census with the distribution of resources (from the annual survey) and examination results, indicating the possibilities of identifying schools that are "outperforming others relative to a) funding and b) socio-economic characteristics." (Crouch 1996: 14)
There are a number of strands in Crouch's argument which require further examination in the context of the potential development of indicators. The degree of 'weeding' of non-exemplary schools that can be performed, or as one might like to conceive of it, alternatively, as 'cherry-picking' of exemplary schools, on the basis of the interlinked data, will be determined by the variation in recruitment between schools within any one census district. If there is a lot of variation within the census districts, then, using examination results, one is more likely to pick out those schools creaming the best students from the district than those which are exemplary, because of what happens at school. Although the data were not available with which to judge the extent of variation, given the vision of school-based management, local accountability, and ultimately, 'choice' which lies behind the agenda on governance, even if, at present, there is very little variability, this is most unlikely to remain the case. Thus, attempting to do what is, ultimately, a very rough and ready cherry picking, is likely to confound performance due mainly to student background than to school activities. Thus, the 'fuzziness' Crouch wants to avoid by such interlinkages, is likely to crop up in another form, namely these poorly specified indicators.16
The second point about developing such indicators relates to the different purposes for which they are more than likely to be used, particularly in the absence of other 'quality' indicators. Although Crouch is advancing the use of such indicators for planning and management, and thus feeding a formative evaluation agenda, there is little that would stop them being used for quite another agenda, accountability stakes, particularly as they look so 'reasonable'. One has only to look at the experience of the United Kingdom in this respect to understand how any sort of league tables, notwithstanding the caveats made concerning their use, become adopted and used in public debate.
Crouch also puts forward some suggestions for efficiency indicators, including learning output/input usage. This particular indicator is also predicated on the interlinkage of examination results with the annual school survey data. Although the argument used here, that "we will certainly never achieve efficiency if we only measure inputs and superficial indicators of quality such as pass and repeater rates" (Crouch 1996: 11) is correct, these hardly account for "real measures of efficiency", given that the "learning output", yet again, will be confounded with the students' home backgrounds. Clearly, one wants to be able to judge whether there is movement toward the goals of redress and social justice, so to some extent, merely producing indicators that can highlight disparities in resource distribution will be of some value. What is tendentious, however, is trying to judge the relationship between differential resourcing and cognitive outcomes. If one found that two schools produced the same 'output' for very different levels of resourcing, the questions that one would ask would relate to the differences between the two schools that account for such different 'productivities'. Some of these differences would relate to the students themselves; others would relate to the measured 'inputs', some 'resourced', but others not, and the great bulk of differences would be unmeasured and unmeasurable, judging from researchers' successes at explaining even a simple majority of the variation in outcomes! This litany is precisely what many school effectiveness researchers have been asking for several decades, refining models to portray more vividly the reality of the school and the classroom. Therefore, it is with some surprise that in the context of thirty years of education production function calculations, Crouch's paper appears to be suggesting that an 'answer' has been found in a simple efficiency indicator. Even were such an indicator to be utilised alongside others, it would be seriously flawed as a complementary tool for policy analysis.
What, however, is exciting about the Crouch paper is that it is grappling specifically, with the interface between macro and micro-level quality indicators, and straddling the formative evaluation/accountability stakes divide by suggesting indicators, on the one hand, that would feed back information for improving the system, while at the same time, be capable of being used as a means of monitoring educational change. Relatedly, the paper is very much alive to the problem of regional aggregation of statistics and the clouding of variation within as well as between regions (Crouch 1996: 17), even if it seems not to have addressed sufficiently the aggregation problems of applying census level data to schools' outcomes, particularly when it will all have to come down to the level of the student in the end, if one is to see changed outcomes.
Footnote
10. The WMES (Welfare Monitoring and Evaluation Survey) includes some questions on the educational level of individuals within the household. The surveys, following typical World Bank LSMS (Living Standards Measurement Survey) procedures, covered a sample of around 10, 000 households nationally.11. It seems that since then, nothing has been done. Apparently the training schools are oversubscribed but the economy cannot absorb them all. There is clearly a case to assess the rate of return of VET vs. general secondary education (see Bennell 1996) to see what type of courses are being offered and to see why enterprises are not absorbing all the output.
12. In categorising the different purposes of performance indicators in Table 9, a division between formative evaluation and summative evaluation is made, the latter being subsumed under "accountability".
13. Not all of the data have been processed, so summary statistics, as well as the production of the 'browsers' for different provinces are at different stages.
14. Educational researchers would be ecstatic if they were able to account for as much as half of the total variance in educational achievement in a population, after controlling for family influences, leaving much room for factors clearly out of the reach of either the national Department or the provincial ministries. Yet, the latter are meant to be accountable for such quality outcomes.
15. See Dalin (1994), especially p.181
16. Indeed, this is precisely what was intended to be done in Namibia, utilising such interlinked data sets. The point being made, however, about adjacent schools exhibiting very different intakes within a single census district, was picked up early on when it became clear that such analyses were confounded by such variation. (See Namibia Ministry of Education and Culture, et al. 1994 and critique by Riddell, 1997).
17. For example, some epidemiologists advocate calculating life expectancy without disability: and there is always the QALY story (Weinstein and Stason 1997, Carr-Hill, 1989, 1991).
18. This emphasis on participation has, of course, recurred in the EU concern with the exclusion of minorities from effective participation in society
19. We might have been, for example, more concerned with assessing the impact of childhood health on learning or the impact of the labour market on the demand for education.
20. These are less relevant to developing countries; but then the problem arises of estimating Purchasing Power Parities (Kavanos and Mossialos, 1996; Murray 1991); and of GDP itself.
21. There are many reverse influences: malnourished children are likely to drop-out, if they go to school at all (Cornia et al, 1987)); illness in the family reduces the likelihood of the children going to school (e.g. Oulai and Carr-Hill, 1994).
22. This is also sometimes because of confidentiality: For example, in the UK where data at small area levels or for small groups are 'Barnardised' - that is -1, 0, or+ 1 are randomly added to the counts.
23. Of course, one cannot expect everyone to be conversant with the technical calculations and procedures underlying many such indices; but we are referring here to the issues of valuation (discussed under the theoretical heading above), which underpin the development of such indices.
24. The statistics department at least. King (1996) writes scathingly about current ILO research work vis à vis the informal sector, noting that the ILO now gives short shrift to the concept compared with its famous 1970s' Kenya Report.
![]()
![]()
![]()
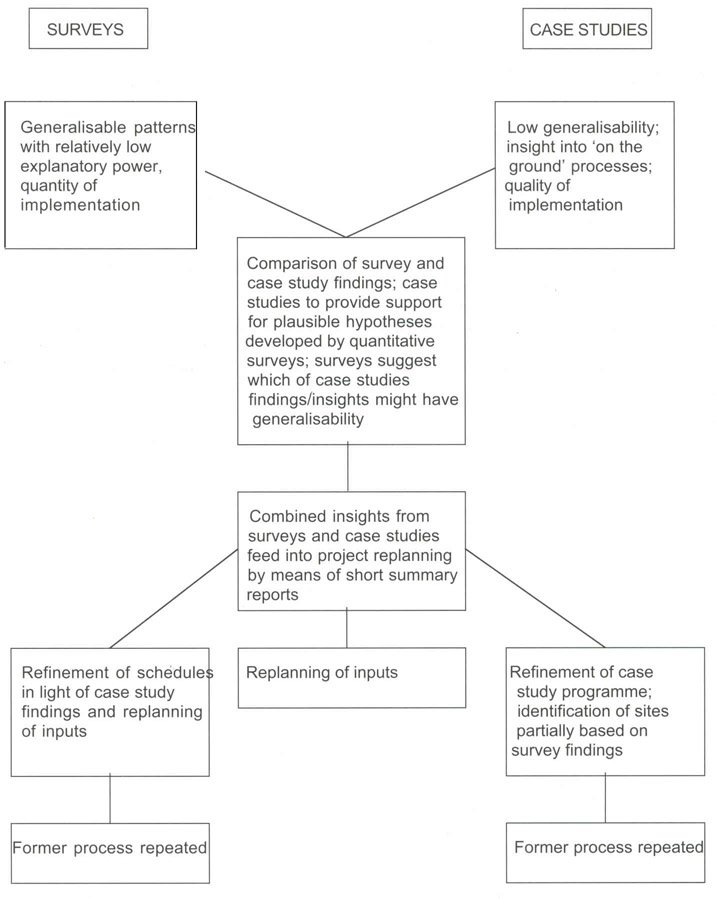